


When considering the cost of a building, it is vital to look at the total in-use and maintenance costs as well as capital investment. David Crewe and Chris Gage of Turner & Townsend examine how ‘iceberg’ profiles can be used for infrastructure projects

Way back in 1998 the Royal Academy of Engineering published a groundbreaking - and at the time - controversial paper. It sought to focus the minds of construction professionals on not just the cost of development and “life cycle” maintenance and repair of a building, but also on the cost of the people who used it. In other words their salary costs and their productivity. If we really understand the impact of the asset on business performance much decision making can be made in the early stages of development to improve outcomes for the occupier, user, passenger, utility bill payer and so on.
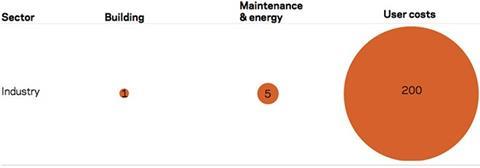
This was often referred to as the 1:5:200 rule and was taken as gospel in some quarters and quoted by eminent practitioners, including Lord Sainsbury and Sir Peter Gershon, in support of their property reviews. So the 1 refers to the capital cost, the 5 would be the cost to maintain the building over its life and the 200 would be the cost of the people using the building. In the PFI world it was also frequently quoted and often termed the “iceberg principle”, as much of the commercial focus at the time was on the little that can be seen, rather than the disproportionate volume of cost below the water level.
Of course, however, the rule was a “rule of thumb” and was just that - as every project or programme varies across the sectors, has different ownership, delivery and operating models and there was no cast iron definition of what was contained within each new term.
Several years after publication of the RAE paper Ray Evans, one of the authors, was quoted as saying: “The construction cost was the total construction cost including land acquisition and professional fees (but not finance costs), maintenance included energy costs, general maintenance decorations and repairs and operating costs included staff costs, consumables and all other business overheads. The lifecycle period used was 25 years.”
But aside from the exact application of this ratio, or the reasoning behind it, the basic rule is a good one: that construction clients and professionals should be aware of the longer-term impact their developments have, not just in terms of the capital cost to build them, but also the life cycle cost and the cost of the people who will use the facility over its lifetime.
In the infrastructure sector the whole-life cost and user cost elements are slightly harder to assess, because the assets are often used on a transient basis (for instance, a station)
- particularly in the regulated industries
- but we think it is worth evaluating, evidencing and making the whole team aware of it as part of the decision-making process. If the whole-life cost impact is understood it will inform key decisions at the early stages of the development and better evidence-based whole life outcomes will result.
In the UK water industry this approach is well established and the vernacular terminology used is now “totex” not “capex” - the total costs of an asset over its life cycle.
There is far greater awareness of the relevant iceberg ratios for any given asset class. This is driven in part by the regulator incentivising authorities to innovate around total operating cost. The benefit of this approach to the customer is that whole life decisions are made which should keep their bills down. Interestingly though in this sector there is no real definition of the “user cost” as water assets have relatively low staff costs. Typically though the capex/opex ratio is around 1:1.
From an international perspective “totex” is important as there is increasing global interest in developing integrated, long-term infrastructure plans and to secure financing through public/private collaboration in funding the capital programme and operating the assets. The market is responding by proposing new sources of major infrastructure funding and development models. National governments are in turn introducing guarantee schemes to stimulate the market and increase scheme viability. The known “iceberg” for an asset class in a given location is becoming a valuable commodity.
All national governments are particularly keen to improve asset life performance through life extension of new capital programmes, prioritise spending to give the best return on investment and to use better delivery and operational models to improve predictability and to “do more with less”. To do all this it helps if you know your icebergs.
How to calculate iceberg costs
In the built environment an iceberg cost analysis is relatively straightforward to do as long as it is realised that each asset class will vary. A good example is the difference between a “Thames Tideway” type scheme and an airport development. An airport is salary “heavy” in terms of its use. For example over 76,000 people work within the boundary of Heathrow and 21,000 at Gatwick. A huge project like Thames Tideway, while being capital intensive, might only directly and indirectly employ a few hundred people at any one time.
A criticism of this approach might be that it doesn’t consider the wider business benefit, but that should be dealt with in the programme business case such as that for Crossrail in London - which while costing £14.8bn will increase rail capacity by 10% and is forecast to generate £42bn of business benefit over its lifetime. Economists can be left to argue about how the cost benefit analysis is derived and on what assumptions.
So, given that knowing the total cost of a given asset development should inform better decision making at the early and most influential stages of a project or programme, how should we go about achieving it?
As with capital cost data structure, taxonomy and nomenclature are key so we have consistency across programmes a common approach leading to trusted and robust data. At Turner & Townsend we’ve used reference points from the sectors and recognised industry standards such as the Building Cost Information Service (BCIS) definitions and structure for capex, the RICS New Rules of Measurement (NRM1), the Rail Method of Measurement in the UK and, for life cycle costs, the Standardised Method of Life Cycle Costing, again from the RICS.
For the staffing costs associated with asset use, standards are limited and not consistent so we have had to develop our own set of definitions and include them in our data taxonomy. In the rail sector for example, we would include all the costs associated with staffing and operating a railway, including station staff, train operators, signalling and train control, but would obviously exclude the costs of the station’s franchised retailer’s staff costs (and the salary costs of the passengers using the network). Our research and the development of industry recognised standards for user costs is ongoing.
The time period over which this is run should be 25 years, but alternatives would have to be considered as technological advances change the way networks operate. In the rail sector, for example, the concept of the train being the “brain” (all signalling being directly in the cab) would change the way signalling costs are incurred (increased rolling stock capital and maintenance costs, lower infrastructure costs).
Geography and environment will also have an impact. Where labour costs are lower the “user costs” are likely to be lower, thus reducing the volume of ice below the water line. This will be the case in the MENA (Middle East and North Africa) region, for example. Similarly in the air sector, all the costs associated with operating an airport, baggage handling, check-in, security, customs, ground handling, plane movement control, emergency services, and so on, are included in the user costs but not the costs of the passengers arriving or departing. The approach is the same for the built environment but as with any sector the specific heads of cost or structure will vary.
How to use an iceberg profile
So how does all this help to make a difference? With icebergs (project profiles) that have most of their ice below the waterline, the focus in the development of the programme should be on optimising the operational and user impact. It may be that the delivery and operational models would be better combined in an alliance style arrangement or one where the operator is responsible for the development process. All the professionals and personnel involved in the development process should be made aware of the facts associated with the data. Thus, the decision making process would be more likely to produce better business outcomes.
The more information there is, the easier that decision making process should become. There will always be an element of human judgement required but better data will always give better outcomes, and will reduce the amount of abortive work undertaken in the process both pre- and post occupation.
How do different sectors’ icebergs compare?
The air sector follows a similar pattern but less extreme to the Royal Academy of Engineering’s original findings. In rail the pattern reverses but this does not inlcude the passengers
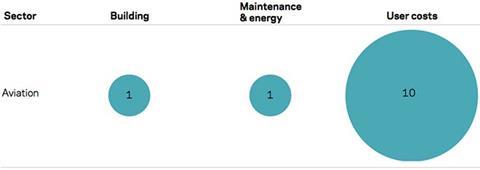
In aviation, assets are hugely complex and expensive to build. But operating them also requires huge resources.
The air sector follows In rail the pattern The management of aircraft, baggage and security are labour intensive processes - 76,000 people work within the boundary of Heathrow and 21,000 at Gatwick.
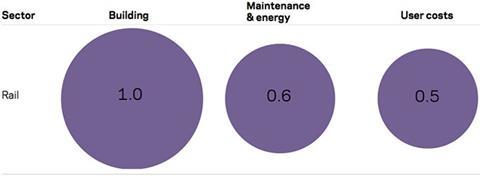
Rail assets are particularly complex and expensive to build. But management of stations and trains is less labour intensive than aviation.
Ticketing and increasingly signalling are automated and this efficiency results in the balance of cost shifting back towards construction and maintenance.


No comments yet