


A 28% quarterly rise in commercial orders can’t disguise the general downward trend, with output falling in most sectors - even in the safe haven of infrastructure. Experian Economics reports
01 / OVERVIEW
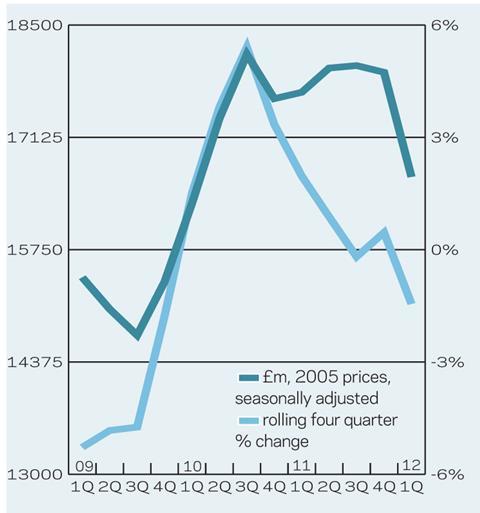
In the first quarter of 2012, construction output totalled £25.6bn in 2005 prices. This was 4% lower on an annual basis and almost 5% down on the final three months of 2011.
Quarter on quarter, the infrastructure sector saw the most marked decline, by 17% to just £2.8bn, the lowest total since the third quarter of 2009. This was unexpected considering that there are a number of large projects under way, and work on Crossrail, the biggest of them, is still gaining momentum.
Public housing output fell by 11% quarter on quarter in the first three months of 2012, totalling just £945m, the weakest outturn since the end of 2009. This is not surprising considering that funding for affordable housing over the 2011-15 period is less than half that of 2008-11. Homes and Communities Agency figures show that affordable housing starts fell by 68% in England over the year to March 2012.
Commercial construction output fell by 7.4% during the quarter, dipping below the £6bn mark again. Although work is continuing on a number of high profile office buildings, activity on the Pinnacle in the City of London has stopped.
The public non-residential sector saw output decline by 6.9% as public spending cuts started to filter through to construction. There is still some work coming through from Building Schools for the Future (BSF) “legacy” projects that were not cancelled when the scheme was stopped in 2010, but these will begin to wind down towards the end of the year.
In contrast, industrial construction output rose by 3%, while private housing saw growth of 1.4%, quarter on quarter.
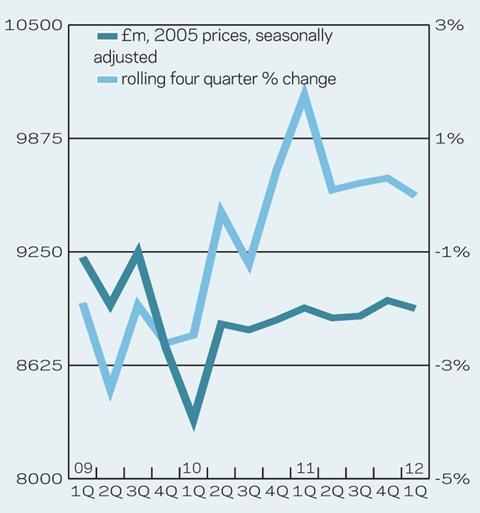
Repair and maintenance (R&M) held up better than new work, with falls of 0.5% and 7% respectively.
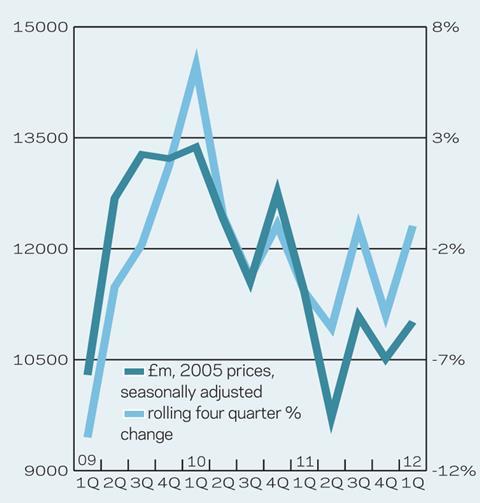
Following a 14.7% fall in 2011, construction new orders rose by 4.6% quarter on quarter in the first three months of 2012, although the total was still 3.6% lower on an annual basis at around £11bn (2005 prices).
New orders for industrial construction rose by almost 58% in the three months to March, although this was from an exceptionally low base, while commercial new orders also rose strongly (+28%), totalling £3.6bn, the highest quarterly outturn since Q310. Rather surprisingly, public housing new orders rose by almost 6% on a quarterly basis but were 41% lower than in 1Q11.
Infrastructure orders, in contrast, dropped by 13.6% quarter on quarter, although they were up almost 60% on an annual basis, while private housing orders fell by 11% to just over £2bn, the weakest quarterly total for almost two years.
Although new orders were up on a quarterly basis, the four-quarter moving total for new orders fell for an eighth successive quarter in 1Q12.
02 / NEW WORK OUTPUT
03 / R&M OUTPUT
04 / NEW WORK ORDERS
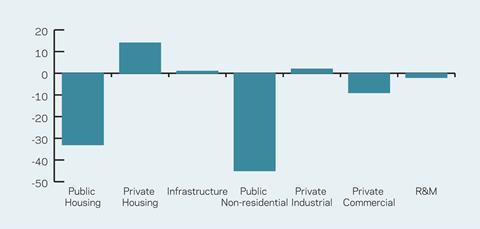
05 / 2012-14 FORECAST
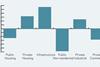
The chart below presents sectoral forecasts for 2012-14. The public sector is expected to fare the worse over the forecast period, reflecting both public spending cuts and the extent to which output has risen in both the public housing and public non-residential sectors in recent years, with substantial funding for affordable housing and BSF.
Infrastructure output is already at a record high and output in the sector in 2014 is expected to be 1% higher than its 2011 level, as work on Crossrail is due to peak in 2013/14.
The private housing sector is likely to be the best-performing over the forecast period, although output in 2014 is still expected to be 24% below its 2006 peak.
06 / REGIONAL NEW WORK OUTPUT
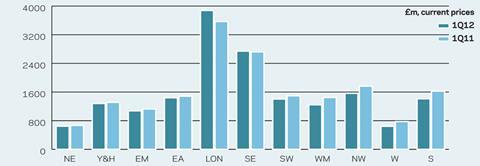
New work output fell across nine of the 11 regions and devolved nations in 1Q12, with Greater London (+9%) and the South-east (+0.9%) the exceptions. There are a number of large projects under way in London, including Crossrail and various station upgrades. In contrast, double-digit declines were recorded in Wales (-17%), the West Midlands (-14%), Scotland (-13%) and the North-west (-11%).
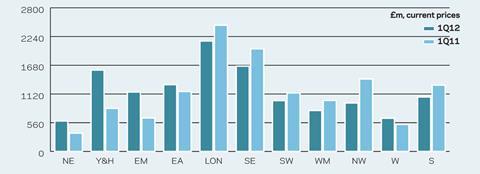
07 / REGIONAL R&M OUTPUT
It was a more positive picture for R&M output, with five of the 11 regions seeing an annual increase in 1Q12. The strongest rises were recorded in Greater London (28%) and the east of England (24%) while the West Midlands rose by 12%. By contrast, output dropped by 27% in the North-east, although it is a relatively small market and thus changes are magnified in percentage terms.
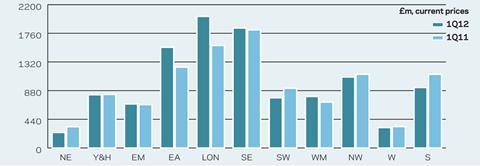
08 / REGIONAL NEW WORK ORDERS
New orders are often more volatile and 1Q12 was
no exception. In Yorkshire & Humberside, new orders rose by 89% from 1Q11, although this was largely due to a 10-year water framework contract being recorded, while the East Midlands (+78%) and the North-east (+66%) also saw substantial increases.
At the other end of the scale, Scotland (-33%) and the West Midlands (-20%) saw marked declines, which does not bode well for output, certainly in the shorter term.


No comments yet