


Britain is building taller, but a lack of guidance on high-rise residential drainage issues is hampering services designers.
There has been a huge shift in the perception of what constitutes a tall residential building in the UK. Not so long ago, it would have been anything more than 10 storeys. Now, towers of 40, 50 and even 60 storeys are being built, and public health designers have realised that BS EN 12056 Part 2: 2000 does not provide clear guidance on sanitary pipework, layout and calculation for buildings of such heights.
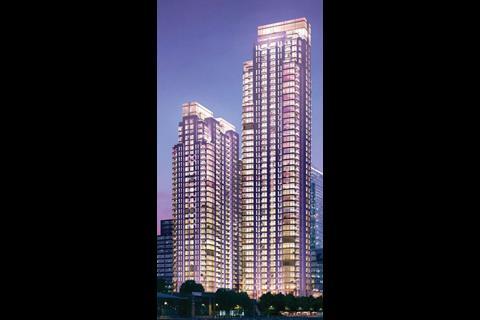
When Hoare Lea was commissioned in 2005 to design the 48-storey Pan Peninsula in London Docklands, the search for appropriate guidance and the resolution of the apparent contradictions between UK and US codes began in earnest. Heriot-Watt University’s AIRNET computer simulation (BSj 10/07, “Seal of Approval”) was central to this search.
Before considering air pressure in the drainage pipework of tall buildings, it is worth establishing what happens to the water. A common misconception is that extremely high velocities develop in the stacks, which may break the bottom of the stacks and require special precautions by way of “velocity breaks”.
Research by Steele in the US and Wise and Swaffield in the UK has shown that the annulus of water that forms within a soil stack reaches terminal velocity at about 3-5m below the point of entry. The difference in water velocity at the stack base in a three-storey building is therefore no different to that in a 100-storey structure.
Problems can occur at the base of stacks in buildings only a few storeys high. These are related to air movement and the positive and negative pressures created, rather than water velocity. Foul air is kept within the drainage pipework via water seal traps, which are very sensitive to pressure changes. The design parameter for negative pressure in a soil stack is set at -375N/m2 and positive pressures are also limited (for convenience) to +375N/m2.
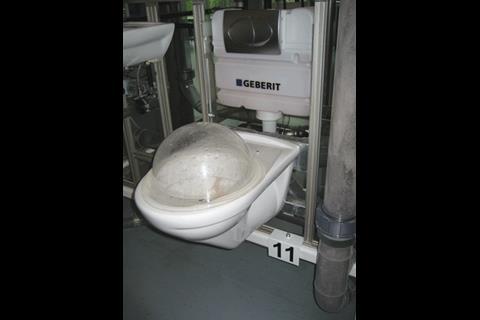
Positive pressure occurs at the base of a stack because the transition from annular to turbulent flow at the bend impedes the flow of air through the system and the positive pressure wave this creates can displace water seals. The photograph below right, taken at the hydraulic tower at Geberit’s HQ in Switzerland, shows the result of extreme positive pressure “blowing out” a water seal, caused by the poor installation practice of connecting an appliance within the positive pressure zone. This issue is not restricted to tall buildings and is well documented. It is not the main problem facing designers.
The shortfall in UK guidance is most noticeable on induced siphonage, defined as “the suction normally associated with air and water flow down the discharge stack which may reduce the depth of water seal in the appliances connected to the stack in the vicinity of the fluctuations”.
When water is being discharged, air is entrained through the open vents of the soil and ventilation stacks at about 8-15 times the water volume entering the system. The taller the building, the further the fresh air has to travel and the resistances generated result in increasing negative pressure as the distance from the open vent increases.
The air/water flow relationship and the pressure regime created was explored by Lillywhite and Wise in the 1969 paper Towards a General Method for the Design of Drainage Systems in Large Buildings. They formulated a scheme of calculation of the maximum suctions and pressures in a stack, where the maximum suction at any point is equal to pressure drop at entry to the stack + pressure drop due to bends and piping in the dry part of the stack + sum of pressure drops across the discharging inlets + velocity head (see Equation 1).
In practice, this formula had to be solved iteratively and computer programs were written to crunch the numbers. The outcome of the calculations was the basis of the ventilation guidance in BS 5572: 1994, Code of Practice for Sanitary Pipework, now superseded by BS EN 12056 Part 2.
The American codes, like the BS, are based upon the translation of steady state empirical data into “safe” design guidelines. This makes it almost impossible to use one code to verify a design based on another because there is no transparency in exactly how these “safe” guidelines were judged.
A table in the American Society of Plumbing Engineers (ASPE) guide demonstrates the contradictions clearly. For the same flow and height conditions as in BS 5572, which requires a 150mm discharge stack and a 32mm diameter vent, US designers are directed to a 127mm vent (ASPE Data Book, Vol 2, Chapter 3, 2004).
It must be said that the US codes are clear; the Americans have been constructing skyscrapers for more than a century, after all. ASPE includes detailed advice on ventilation requirements of buildings up to 100 storeys. However, the guidance is so conservative it would be hard to defend against accusations of overdesign in the UK market.
Figure 1 shows the principles adopted for the Pan Peninsula, which can be described as a BS and ASPE hybrid. The main soil stack is 150mm. It is limited to one appliance group per floor and has no connections from the lower 10 storeys. The lower floors are connected to a separate 100mm stack, except the lowest floor which drains via a stub stack.
This arrangement of the lower 10 storeys draining into a stub stack and a 100mm primary ventilated soil stack is from the BS. The 150mm main soil stack with 100mm cross-vents at five-floor intervals is broadly from ASPE, as is the designation of the 100mm primary ventilated stack as a “wet” and “dry” vent.
Had a typical BS design been used throughout, there would have been a smaller vent (50 or 75mm) and a cross-vent at every floor interval. A typical ASPE design would be likely to have a larger vent (150mm) but cross-vented only at 10-floor intervals. An ASPE-designed system would include individual trap ventilation. Unventilated branches are the norm in UK residential schemes.
This arrangement dealt with the issue of positive pressure at the base. What was less certain was whether pressures in the 150mm stack would remain within the -375N/m2 criteria, because neither BS nor ASPE gives a method of calculating this or taking the information from tables.
To verify the design, Hoare Lea approached Heriot-Watt University to see if the AIRNET computer simulation could be used to model a typical stack.
Although the codes are based on steady state flows, the fluid flow phenomena in drainage systems are inherently unsteady. Flow rate, annular downflow thickness, entrained air flow and suction pressures will vary with time. As a result, the pressure transients generated by the entrained airflow vary with both flow and time and the greater the rate of change, the greater the transient pressure. This is significant in a system protected by 50mm and 75mm water seals. The sudden change in air flow is similar to the situation in a water supply system where a valve is rapidly opened or closed and water hammer occurs.
In fact, it is the same expression, developed by Joukowsky, that describes the condition – see Equation 2, above. As an example, a 1m/s air flow with density 1.2 kg/m3 and a wave speed of 325m/s will generate on stoppage (at the base of a stack if surcharge occurs) a transient pressure at the closure point of 390N/m2 or 40mm water gauge.
AIRNET is a method of characteristics (MoC) simulation that models the passive and active boundary conditions within a system and, together with the driving functions which determine the entrained air flow, simulates the behaviour of the system over a predetermined period of time.
Figure 2 (left) is a CAD reproduction of the line drawing generated from the AIRNET graphical interface and shows the model created. The number of branches and traps and the minimum unit of measurement (1.0m) were chosen to keep the model size down. All the cross vents are included, and trapped branches at the mid-point between each pair of cross vents.
Trapped branches are also included at the top, middle and bottom of the wet vent. Water flow was taken from the original project calculations (based on BS EN 12056 Part 2 discharge unit method), with 6.0l/s entering the main stack and 2.6l/s entering the wet vent. In this simplified configuration, a simulation of 40 seconds of system behaviour takes two to three minutes to run.
A series of spreadsheets is created to graph the data output to show various outcomes. Figure 3 (right) shows the air flow through the system and can be used as a “sanity check” to ensure the model is built correctly. This means checking that the sum of the air volumes being entrained into the system is the same as the volume of air leaving the system.
This graph also shows the air flow through each of the cross vents and its direction. In upper parts of the system, air can be seen being drawn from the wet vent, but at the bottom of the system the wet vent is drawing air from the main stack via the lowest cross-vent (pipe 17). This shows how the increasing resistance to air flow because of the length of the vents results in air circulating around the system. This is because the system cannot react quickly enough to provide “new” air when required by water discharging in the “wet” sections of the wet vent.
Figure 4 shows the pressures that develop in the stacks. Positive pressures can be seen at the base where water curtains form at the transition from annular to turbulent flow. The maximum positive pressure is in the main stack, as this has the highest water flow and thus the largest volume of entrained air. At +7.2mm water gauge (71N/m2), this is comfortably within the +375N/m2 limit of design.
Looking at the negative pressures in the cross vents, it can be seen that they are doing their job of pulling (suction) air from the wet vent. This also shows that the negative pressure increases further down the building, because of the increasing friction loss as the air flows through the system. The maximum negative pressure recorded is -22mm water gauge (216N/m2). This is also well within the -375N/m2 limit of design.
The fact that the pressure regime is well inside the design parameters indicates that trap seal retention will also be better than the 25mm required. AIRNET shows trap seal retention of 72–60mm. Figure 5 shows the worst case of 60mm retention.
By using AIRNET, we were able to show that the Pan Peninsula system behaved in general accordance with expectation. AIRNET also demonstrated that the minimum and maximum pressures and trap retentions are within the parameters in UK and US codes.
The model shows that the further air has to travel to the point where it is needed, the greater the negative pressure. Therefore, the height of any system will always be limited by the relationship between water volume, and the air volume this entrains, and the friction this air encounters as it travels. In this respect, the ASPE guidance is more robust because although the safety margins are exaggerated, it does demonstrate this relationship. The BS does not.
This, coupled with the less conservative safety margins, could lead to problems should a designer not appreciate that the BS is only directly applicable to buildings about 25 storeys high. A “health warning” on this limitation would be welcome until it is redrafted to reflect the increasing heights of buildings.
AIRNET is not “user friendly”: it is an academic research tool – which could be used to inform a redrafted BS. Hopefully, it will be developed and sold as design software. This would allow public health designers to verify code compliance of hybrid or other non-standard system arrangements.
Original print headline - A tall order
Downloads
Figure 1: Pan Peninsula “typical” stack
Other, Size 0 kbFigure 2: AIRNET model of typical stack
Other, Size 0 kbFigure 3: Pan Peninsula conventional design – air/water flow rates
Other, Size 0 kbFigure 4: Pan Peninsula conventional design – stack pressures
Other, Size 0 kbFigure 5: Pan Peninsula water pressure in trap 13
Other, Size 0 kbEquation 1
Other, Size 0 kbEquation 2
Other, Size 0 kb
Source
Building Sustainable Design
Postscript
Peter White is public health principal at Hoare Lea

1 Readers' comment