


Results from the Family Spending Survey show that households spend less on contractors than they did 10 years ago

Britons appear to be spending ever less on contractors to do up their homes, despite the popular view that people are investing to stay in their homes rather than move.
That’s certainly what the official construction output figures show and so do the family spending data released this week. And the decline didn’t start with the recession it is far more longstanding.
According to the family spending survey, households spend less on contractors now in cash terms than they did a decade ago.
But as well as revealing a worrying trend the figures also provide other interesting insights into the official ONS construction output data on private housing repair, maintenance and improvement work, which have been a source of some concern for a while.
According to the ONS data the historic high point for the construction industry was the first quarter of 2004. This is something that puzzles those long-suffering statistically-minded folk in construction. It sits uneasily and seems counter intuitive given the general strength of the industry over the period. But while I also find it hard to accept, it doesn’t mean it wasn’t the case that construction did actually peak in 2004.
It is here that the family spending statistics provide some clues. There are three basic reasons, if we believe the figures, for the slump in work after 2004. Spending on infrastructure slumped, a boom in public spending on buildings faded and private housing repair and maintenance work began to slide. It then took a while for growth in other sectors to fully compensate and technically the industry was in recession from late 2004 to early 2006. By the time lost ground was recovered the recession hit.
That is the narrative we read from the data. The slump in infrastructure is not generally disputed. The slump in public sector work over the period is understandable as work on the ground shifted from revamping the health service estate to rebuilding schools leaving a bit of a gap. There is however an unease over whether the private sector repair and maintenance figures went so drastically into decline and so early in the cycle.
From 2002 to 2007 there was, according to the ONS construction output figures, a 21% drop. That seems a bit mad given the excitement in the housing market at the time. However, while I remain concerned about the data, they may not be as mad as all that if we look to other sources of data for corroboration.
When the latest family spending data was released it prompted me to look again at this conundrum. The data available here is not going to be a direct match for the data collected by the ONS for construction output, but that is precisely why it is interesting. The two surveys are measuring similar things differently.
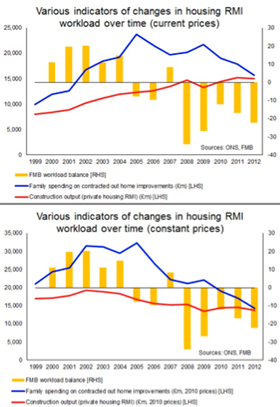
I have plotted the data from the family spending survey for contracted home improvements against the official private housing repair, maintenance and improvement output data.
The family spending data is adjusted to remove VAT (this is crude, but some adjustment is necessary) and I have scaled up to represent all GB households annually.
I have also added into the mix the workload balance data back to 2000 for residential RMI from the Federation of Master Builders, a group very sensitive to changes in domestic construction work. The balance is an average over the year of the quarterly figures for the difference (on a percentage scale) between those doing more work and those doing less.
I have presented the data at current prices and in a separate graph adjusted for inflation using the output indices provided by the ONS in the construction output figures. It must be noted that there among construction analysts some concerns over the accuracy of these particular indices. There is a view that they may assume too much inflation. However they are used here more for indicative purposes.
The data and graphs throw up quite a few interesting points, not least that the scaling of the family spending data for contracted out home improvements is not wildly away from that of the private housing repair and maintenance. That surprised me, given survey errors and the issues of scaling up.
Personally what fascinated me was that the family spending data seemed to diverge greater from the output data in the mid part of the noughties. This to some extent fits with a pet theory I have that there was undercounting of construction activity in the years when skills shortages encouraged contractors to tempt labour from abroad (see blog).
However, what all the data suggest is that home improvement work has been and remains on a fairly long-term slide.
The crucial difference between them, however, is when the sector began its decline. Looking at the deflated series, the output data suggest the fall started in 2002 to 2003, while the family spending data suggest the decline was a couple of years later. This seems also to be supported by the FMB survey which shows growth through to 2004 before a decline in 2005 and 2006 before the recession really hit in 2008.
The fact that the decline may in reality have occurred later than the official statistics suggest is important as it would shift if not remove the recession that the industry apparently suffered between late 2004 and early 2006.
That said, examining the family spending survey data does seem to add some support to the official ONS data on the decline of private housing repair and maintenance. But issues of timing remain and other questions remain, particularly over the output price indices.
But what is more worrying is what lies behind the steady downward slide in housing RMI.
I am left however with one disturbing thought. The timing of the decline fits rather too spookily with the demise of Changing Rooms in 2004. Could it be that this TV programme really did have a profound impact on the level of construction work in the UK?
Brian Green is an independent analyst, commentator and consultant working in construction, housing and property


No comments yet