


A slowdown in the growth of the global economy brings both challenges and opportunities for the construction sector around the world, alongside some cause for cautious optimism, says Agnieszka Krzyzaniak of Arcadis
01 / Introduction
“May you live in interesting times,” said the Chinese curse famously referenced by US senator Robert F Kennedy in a 1966 speech. More than 50 years later, the times are indeed interesting, thanks in part to the actions of the US and China.
As for how the construction industry is feeling, lots of people can probably relate to the words: “You can’t always get what you want,” by the Rolling Stones.
As much as many would like to see an injection of optimism, the most the International Monetary Fund could offer in its latest update was “still sluggish global growth” and an adjustment of global growth forecasts to 3.2% for 2019 and 3.5% for 2020.
Continuing uncertainty around trade relations – between the US and China; the UK and eurozone, with an increasing likelihood of a “no-deal” Brexit; and the US, Canada and Mexico – as well as emerging tensions in the Persian Gulf – add to the challenge.
The landscape might seem gloomy for the construction sector, but that is not necessarily the case. Looking across factors such as currencies, commodity prices and the latest governmental initiatives around the world, there are reasons for careful optimism. The global economy and construction are of course highly interdependent, and together are a source of both opportunity and threat.
Paradoxically, slowing growth could be the stimulus the construction sector needs to finally tackle some of its long-standing issues, such as low productivity, slow uptake of innovation, and impacts on the environment.
02 / Construction markets around the world
While the extent of construction activity in markets around the world varies, the outlook is generally positive, with multiple examples of governmental initiatives aimed at sustaining and/or increasing output.
US
In the US, despite the ongoing trade feud with China and a GDP prognosis for 2019 of 2.6% (a 0.3% decrease on 2018 GDP growth), optimism is still high among contractors and equipment distributors. Residential sector recovery is expected later in 2019 and in 2020. President Donald Trump’s recently created council on eliminating barriers to affordable housing development could facilitate future growth.
Investment in infrastructure also remains strong, driven by the need to expand and to address issues related to ageing assets. Additionally, big tech is driving large mixed-used schemes including Facebook’s $850m (£703m) Willow Campus in San Francisco, California, and Microsoft’s $1bn (£827m) Redmond headquarters in Washington.
China
China’s GDP is growing at the slowest rate since 1992 – 6.2% in Q2. It has become clear that its current growth model has reached a peak and further reforms are needed. A trade war with the US has only added to the challenges. State-driven, large-scale investments in transport and energy infrastructure continue, and are likely to do so, especially in view of recently relaxed infrastructure project finance rules. A temporary decrease in renewable energy investment has been mainly caused by moving away from subsidies for solar and wind. This is likely to be overturned as additional funding comes from the World Bank for the China Renewable Energy and Battery Storage Promotion Project. China is also experiencing a boom in hotel construction, while investment related to the 2022 Beijing Winter Olympics will soon kick in.
India
As one of the few countries to maintain an increasing trend in GDP growth, India is expected to achieve 7% growth in 2019 and 7.2% in 2020. Construction growth is set to continue, aided by the recent election success of prime minister Narendra Modi’s Bharatiya Janata Party coalition. He has previously expressed commitment to significant infrastructure investment, especially around the access to potable water. Indeed, last month’s budget focused on increased infrastructure spending, easing rules around foreign direct investment and improving life in rural India. Investment in renewable energy is also expected, following the government’s pledge to increase the share of renewables in the total energy mix to 40% by 2030.
Australia
The Australian economy is slowing, as reflected by the revised GDP projections from Reserve Bank of Australia of 1.75% in June, down from 2.5%. The outlook for residential is uncertain, following a sharp decline in housing approvals (-21% May 2018 – May 2019).
Like many regions, growth is likely to be attributed to investment in infrastructure, with the 2019 budget granting A$73bn (£13bn) for infrastructure over the next 10 years. Initiatives related to renewable energy also continue, driven by the country’s pledge to source 50% of energy from renewables by 2025. Recently, Victoria’s biggest solar farm has been completed and construction has also started on the world’s first liquid hydrogen project.
Europe
In both Western and Eastern Europe, despite low GDP forecasts, the outlook for the overall construction sector is positive. Across Germany, regardless of a slight loss in construction momentum, the market remains strong. Following a better-than-expected opening quarter when mild weather triggered boost in new orders and output, activity has plateaued. Yet, construction companies do not seem discouraged and rates of hiring are increasing. Low interest rates are expected to facilitate the initiation of new building projects.
Stimulated by government infrastructure investment including the Grand Paris Express, a further expansion of high-speed rail and the initiation of preparations for the 2024 Paris Summer Olympics, the French construction sector is growing at a modest pace of 1.7%.
In the Netherlands, 2019 GDP growth is expected to reach 1.6% and it is likely to stay at similar level in 2020, as the Dutch construction market comes to the end of a boom. An additional trigger for construction, especially in Amsterdam and Rotterdam, are Brexit relocations, with Dutch cities hosting bodies including the European Medicines Agency.
Poland is one of the most dynamic economies in the EU, with growth of 4% pencilled in for 2019. The Polish construction sector has experienced high levels of volatility as the government’s plans to upgrade and expand infrastructure have coincided with a housing boom. Inflation in 2018 exceeded 15% as the industry pulled out of a short-term dip in activity. With $27bn (£22bn) of construction under way and a further $85bn (£70bn) in the pipeline, pressure on resources is expected to remain.
03 / Snapshot of the international construction costs index
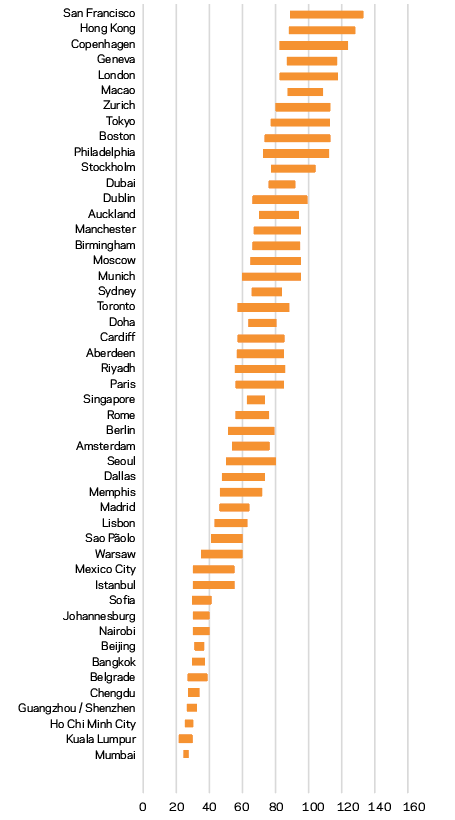
This year, New York and San Francisco have swapped places but remain the two most expensive cities in which to build, closely followed by Hong Kong. There were only slight changes to the rest of the top 10, notably with European cities (Copenhagen, Geneva, London and Zurich) moving marginally ahead of East Coast US cities Boston and Philadelphia. Some newcomers appeared in the lowest part of the index, including Chengdu and Shenzhen in China and Belgrade, Serbia.
Insights from additional locations, both in the upper and lower part of the index, indicate that a global convergence of construction costs is taking place, with a slight narrowing of the gap between the lowest and highest cost locations.
The inclusion of additional cities in the index provides a richer picture and allows us to extract the differences on a national level. For example, cities in the US span index positions from the very top (San Francisco and New York) to the bottom half (Dallas, Memphis).
This difference is caused by multiple factors including structure and availability of workforce, current project pipelines and also the level of project specifications. On top of that, historically successful locations such as New York and San Francisco have been a focus for wealth and investment for a long time and have become more and more regulated. Conversely, more deregulated states in the south and west such as Texas and Utah have taken deregulating steps to become more competitive as locations to live and work.
In the UK there is also a wide range of cost – albeit over a far smaller area. London remains in the top 10 most expensive cities – highlighting the remarkable resilience of the UK’s commercial and housing sectors over the past three years. Concurrently, Manchester and Birmingham have been catching up. Significant levels of investment in regeneration, supported by the prospects of HS2 and the Northern Powerhouse, have been driving higher inflation in regional cites
than in London, with specifications upgraded in response to user expectation. On the other hand, Cardiff and Aberdeen, further down the index, display the characteristics of a more local market, smaller in size, with lower labour costs and lower project specifications. Interestingly, regional cost variations elsewhere are much less pronounced – reflecting the more decentralised nature of many European construction markets.
Looking across the anticipated levels of tender price growth, a few locations stand out – among them Dublin, Rotterdam and Amsterdam, with tender prices increasing at 6%-9%. Ireland’s recovery from the crash is still running at full throttle. These locations would be likely to see increased levels of activity in the medium term in the event of a disruptive Brexit, as more businesses in the UK relocate at least some of their operations to the EU.
Elsewhere, remarkable cost increases of around 16% have been seen in Warsaw as the market recovers from a recent slump. This is the combined result of a full affordable housing pipeline and infrastructure upgrades, favourable investment conditions luring foreign investors and increasing workforce shortages.
About the Construction Costs Index
The Arcadis International Construction Costs Index provides a comparison of construction costs across 100 global cities. Apart from providing a comparative indexation of construction costs around the world, the report also provides market insights and highlights opportunities for performance improvement associated with innovation, sustainability and end-user benefits. This article includes data for 50 cities. The full report can be accessed via Arcadis.com.
The index is based on a survey of construction costs of 21 building types, based on local specifications and denominated in USD to enable comparison. The ICC compares the costs of delivering a building function in different locations rather than a like-for-like comparison of the costs of a similar type of work.
04 / Currency trends
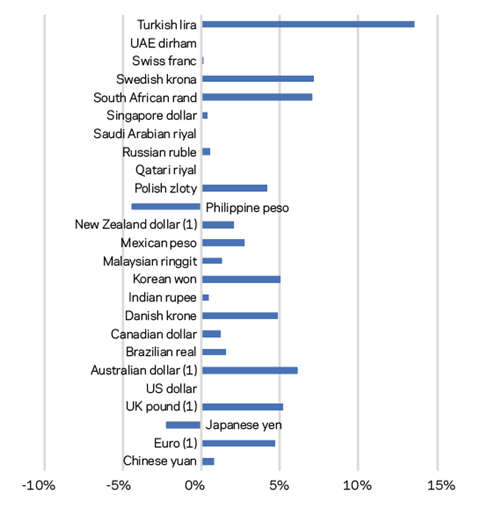
After a relatively quiet few months, the currency markets have been set alight by an escalation in tensions between the US and China and by growing fears of a no-deal Brexit. A positive interest rate policy in the US means the US dollar (USD) remained relatively strong in Q1 2019, appreciating against a basket of world currencies. The unexpected fall in the value of the Chinese Renminbi (RMB) to more than seven RMB to a USD in early August, following a 0.25% rate cut, has triggered a further escalation of the trade war.
President Trump wants a cheaper dollar to boost US exports, but this aim is incompatible with the US’ current economic strength and the role of USD as global reserve currency. One of the objectives of the interest rate cut was to
reduce support to the value of the dollar. However, the Federal Reserve’s lukewarm prognosis for future cuts in rates has undermined this policy.
Dollar appreciation
The effect of dollar appreciation is to make construction costs in other locations less expensive relative to US cities, which has affected Europe more than emerging markets. Over the past year, the USD gained almost 5% against the Euro and between 4% and 7% against other European currencies. The Australian dollar depreciated by 6% against the USD, owing mainly to lower than expected economic performance caused by declining manufacturing and mining outputs.
By contrast, in emerging economies, the pace of dollar appreciation has been slow – approximately 1% – which in turn has reduced pressure on costs of servicing of dollar-denominated debt. The Indian rupee, for example, depreciated by only
0.45% over the year. The Turkish lira remains one of the world’s basket-case currencies – seeing a further depreciation of approximately 13% against USD – although compared with the last year’s 90% fall, this can be read
as a token of recovery. In our sample, two currencies strengthened against the dollar: the Philippine peso and Japanese yen.
Sterling
The performance of sterling remains closely related to developments around Brexit. GBP depreciated by 18% against the dollar between the referendum and the end of July this year. After the initial shock, partial recovery took place throughout 2018, but this trend has been reversed. Within Boris Johnson’s first week as prime minister, further depreciation of sterling by 3% took place. Morgan Stanley analysts believe that in the event of no deal, the pound could fall to as low as “one-for-one” against the dollar. This would make the UK a competitive exporter but would be expected to drive inflation as a result of rising import costs.
05 / Commodities
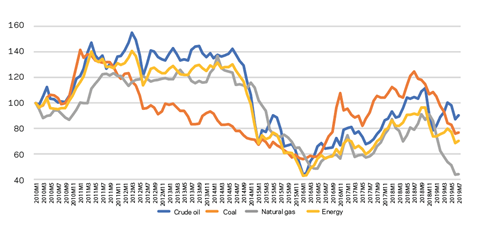
While the first half of 2018 saw price increases of many commodities, the trend changed dramatically in 2019. Energy prices have decreased by 25% over the last 12 months, driven mainly by a remarkable decline in the average price of coal (-39%) and natural gas (-44%). For coal, this has been caused by lower demand associated with decarbonisation. For natural gas, the shift towards cleaner fossil fuels drives the demand – but the US shale gas boom combined with a change in regulation has resulted in remarkable increase in exports from the US to other markets.
The availability of infrastructure on both sides of the Atlantic, for example the liquefied natural gas (LNG) port in Poland, has enabled the import of US gas, which at the time of writing is 30% cheaper than the gas produced in Europe or Russia. Through 2018, the export of LNG from the US has spiked by 53% in total, and by 272% to Europe alone, pushing the prices of Russian gas down by more than 50% in the last 12 months.
The price of Brent crude oil decreased on average from $70 (£59) per barrel in H2 2018 to $60 (£50) in the first months of 2019. Recent tensions in the Persian Gulf are not likely to drive up prices, as the US has reached all-time high levels of oil export – 3.3m barrels a day in June. Oil majors including Chevron and Exxon Mobil continue exploration activities as well as energy diversification, while large-scale exploitation of reserves off the coast of Guyana will add to supply.
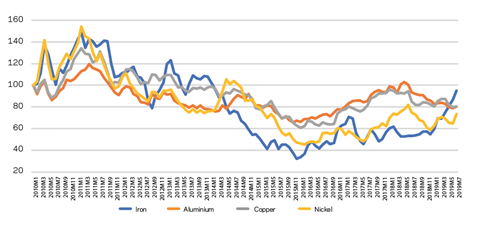
The average price of metals increased by 11% in relation to July 2018. Copper, nickel and aluminium maintained a downward trend; however, this was more than compensated for by a significant, but one-off increase of 63% for iron ore – the highest since 2014, due to continuing demand from China and limited supply from Brazil caused by mining firm Vale’s dam disaster in January. So far, no significant increase in steel prices has been observed.
06 / Conclusion
The global economy’s rate of growth is slowing. This is a source of concern, but for construction it could be the push needed to change things for the better. The world’s population is facing a number of challenges, from increasing urbanisation and lack of affordable housing, to ageing infrastructure, constrained resources and climate change.
In order to address these issues, the sector will need to continue transforming to proactively address shortfalls around productivity, skills and environmental impacts. These problems apply around the world – whether it is a construction of water infrastructure in India or mixed-use developments in California. Shortages in skilled workforce are especially prevalent across global markets.
Governments are actively encouraging collaboration between industry and academia, aimed at the development and implementation of innovative solutions. Some of these are specific, for example the Green Construction Through Wood programme launched by Natural Resources Canada, which explores the use of wood in non-traditional construction projects, or the Australian Advanced Manufacturing Growth Centre and the Research Council Training Centre for Advanced Manufacturing and Prefabricated Housing. Other solutions have a broader remit, focusing on enhancing wider innovation across the sector, including the Construction Innovation and Technology Fund in Hong Kong and the UK’s Construction Sector Deal.
Key research
Research from some of the industry’s biggest players is helping to gradually change the perception of the sector as slow and outdated. Investment is being directed into diverse projects – developing concrete to reduce a carbon footprint by 70%-80%, artificial intelligence for project management or virtual reality for the on-site safety – to name a few.
However, technical developments alone will not fundamentally transform the industry. The challenge remains to change the mindset of the sector – the use of BIM and digital twins, for example, did not protect Crossrail from delays and cost overruns. But this should not come as a surprise or be source of disappointment. The reflection here is that digital technologies, to be successful, require new ways of working and tackling some deeply ingrained cultural issues – at each stage and potentially in each profession involved.
Construction is not just facing a skills shortage, but also a shortage of long-term thinking about the new capabilities required to fully realise the potential of theoretical ideas. The circular economy has been a buzzword for a few years already and today, thanks to digital technologies, concepts such as Buildings as Material Banks, become possible. This introduces a new way of thinking about the assets – as a temporary storage for resources that in the future will be reused. But are demolition technologies being reviewed to ensure that what we will be able to recover is high quality? Are we training architects to buildings made of limited or exactly defined resources?
In a “smart” world, it is time for construction to become smart too. The industry needs to think ahead – for the sake of its own and wider economic resilience.


No comments yet