


Simon Rawlinson and Andrew Beard of Arcadis examine the latest trends in international construction costs as markets around the globe adjust to post-covid recovery, the Ukraine war and other factors
01 / Introduction
Global economies bounced back strongly in 2021, even as outbreaks of covid continued to disrupt supply chains around the world. Overall, world GDP expanded by 6.1% according to the IMF, a marked contrast to the near 5% contraction recorded in 2020. However, the recovery was far from painless. The story of international construction markets in 2021 is a near-universal tale of resource constraint, disrupted delivery and rising prices. Clients that set out to “build back better” found themselves struggling to deliver their programmes.
There were many triggers for the difficult market conditions that were experienced across global markets. Ultimately a combination of reduced inventory and stretched supply chains in all markets set off a sequence of mostly unrelated problems that combined into the biggest products and materials squeeze in 30-40 years.
Sky-high iron-ore prices, record container rates, volatile energy prices and shortages of key components such as microchips were all symptoms of wider problems caused by the simultaneous reopening of developed economies. Construction was more exposed to the rebound than many sectors due to buoyant markets in infrastructure, new homes and home improvement. Arcadis’s international construction costs (ICC) index showed double-digit inflation across many markets, with particularly high increases in the US and some parts of Europe including Germany.
>>> Also read: UK market forecast: the costs of uncertainty
>>> Also read: A five-point plan for coping with volatility in a positive way
Looking forward, how should the industry respond? High prices and the increased risk exposure triggered by the Ukraine conflict are likely to dampen demand, particularly in the price-sensitive domestic market. However, there is sufficient investment support from the public sector and infrastructure to maintain workload at historically high levels.
Smarter working, focused on delivering more value with less labour and materials resources, has emerged as the key post-pandemic productivity challenge for the construction industry. Whether by automating aspects of design and installation through automation, by reducing material requirements through the rationalisation of standards, or by the elimination of avoidable waste, the lessons of 2021 are that clients cannot afford not to challenge current ways of working.
02 / The cost index snapshot
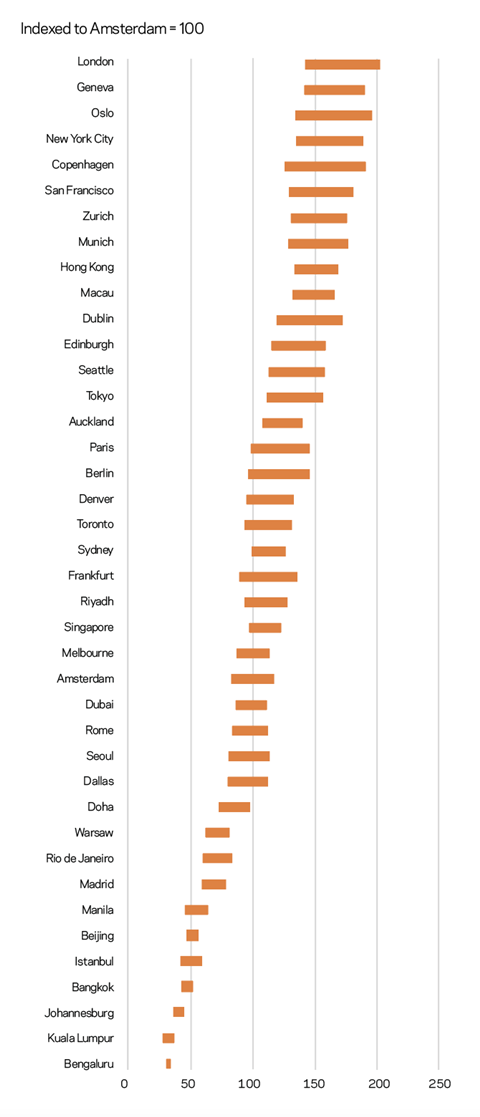
The Arcadis ICC index for 2022 covers 100 locations. The data was collected in the fourth quarter of 2021. Projects delivered in accordance with local specification standards are compared on the basis of a currency conversion to US dollars.
London, Geneva and Oslo are the three most expensive locations in the index. New York and San Francisco are also in the top 10. Munich is a new entrant, ranked eighth, and Hong Kong and Macau are ranked ninth and 10th respectively.
Three main market trends have determined changes in rankings throughout the ICC index:
- Strengthening of the US dollar against most major currencies – this trend supported relative prices in markets that have a US dollar peg, including the Gulf States, Hong Kong and Macau.
- High (10%-plus) inflation in many markets including the US, Germany, Singapore and the Iberian peninsula, which resulted in significant movement of cities up the index.
- Low (sub-5%) inflation in Australia, Hong Kong and the Gulf States resulting from a slow recovery, triggering some downward movement – particularly for cities in Australia and New Zealand which typically fell 10-15 places in the index.
The top cities in the index, London, Geneva and Oslo, were not exposed to particularly high levels of inflation in 2021. However, historically high costs in these locations linked to specification standards and procurement practice mean they remain at the top of the ICC index.
The biggest movers up the index in 2022 are smaller US cities, particularly locations associated with lower costs in the southern and central states of the US. Denver, for example, moved up 14 places in the overall rankings.
The upshot of the analysis is that US dollar-denominated investors have secured further competitive advantage during 2021 as a result of the strengthening of that currency. With US construction markets running very hot as a result of the rapid recovery and federal investment programmes, investors may choose to look overseas for opportunities, providing additional support for commercial and residential construction across many markets.
Figure 1: International Construction Costs Index 2022
03 / Regional analysis
US
The US construction market was worth $1.5tn in 2021. Recovery from covid-19 was mixed during that year. Uncertainty caused by covid-related restrictions triggered a decline in commercial workload, and the passing of the new bipartisan infrastructure law was delayed until November 2021. Infrastructure workloads remained steady, supported by state- and city-level recovery initiatives such as the six-year $45bn Reinvest Illinois Capital Plan. By contrast, the US housebuilding sector had its busiest year since the global financial crisis, with over 1.7 million residential permits being issued, up 25% compared with 2019.
Even though overall growth in construction activity was modest, the US experienced some of the highest inflation recorded in the ICC survey. In part this was due to the considerable strain that the booming single-family housing sector created, triggering problems such as a global shortage of structural timber. Almost every project was exposed to these problems, requiring extreme measures including early design freezes and accelerated procurement.
Prospects for 2022 look better. Covid restrictions are being lifted, investor confidence is returning, and federal programmes for infrastructure totalling $110bn will commence.
Australia
In Australia the economic recovery post covid has started, after having been delayed by one of the world’s toughest lockdown regimes. Effective management of the pandemic means Australian authorities are confident that the bounce-back will be brisk now it has started. However, delayed growth has translated into a slower than expected recovery in the construction sector.
Over the past year, a weak work pipeline has resulted in a very competitive projects market, with little inflation passed to clients. Workload is now returning, driven by commercial, industrial and residential markets, with a focus on data centres and institutional rented housing. While public investment works are not yet in full swing, planned infrastructure investments are likely to put even more strain on resources, which can be expected to translate into inflationary pressure from 2022 onwards.
A severe shortage of construction workers is expected to present a huge challenge to the industry. Construction vacancies have increased by 80% since late 2019, and by 2023 there will be more than 100,000 unfilled roles in the sector.
As confidence returns to construction, it urgently needs to focus on transitioning to being a more resilient industry investing in digital, modern methods of construction and practical measures to improve sustainability.
China
The Chinese construction market was worth more than $1.1tn in 2021. Growth continued throughout the pandemic, thanks to the decisive management of outbreaks as they emerged.
Continuing growth has been supported by investment in infrastructure in small and medium-sized cities. The commercial sector also did well, with particularly high levels of investment by the tech sector in first- and second-tier cities and some retail and grade A office development. The residential sector had a more difficult year. There is a genuine need for new housing, but the market slowed as authorities took action to stabilise some heavily indebted developers. New measures including smaller deposits and lower mortgage rates should stimulate demand.
Chinese construction markets were exposed to moderate inflation of around 5% during 2021. Labour resources were plentiful, and price rises were driven mostly by soaring material costs. China’s 14th five-year plan was launched, including a major push for carbon neutrality, a target to increase the share of population living in cities, and a commitment to protect biodiversity. In the immediate short term, the success of China’s zero-covid policy will determine how quickly locked-down cities can return to normal levels of activity.
EU
Many EU construction markets were disrupted by covid-related closure in 2020, so a strong bounce-back was always likely. Ironically, some of the markets that were least disrupted by the pandemic in 2020, such as Germany, faced the greatest resource and inflation challenges in 2021 as continent-wide demand for materials and labour piled on the pressure. Across the continent, projects faced delay and disruption as contractors focused on programme recovery. Major schemes such as the 2024 Paris Olympics development have needed to respond proactively to market challenges to stay on programme.
Growth had been expected to continue at around 2% to 3% in 2022/23. However, further materials price rises in the pipeline make it likely that some market-sensitive sectors such as commercial and logistics will slow down. One area likely to see significant growth is the decarbonisation of existing building stock, which expects a boost in investment underpinned by the European Recovery Fund.
04 / Impact of the Ukraine conflict
The cost index was compiled before the outbreak of war in Ukraine. By mid-April, there were some clear signs of the impact the conflict might have on construction, focused on metals and energy markets.
Initial economic forecasts by the World Bank suggest that outside of Ukraine, Russia and Central Asia, the effect on economic growth will be limited. Eastern European states such as Poland will lose 1% of economic growth, for example. However, the WTO has cut its forecast for trade growth by 50% to 3% as a result of the twin impacts of the war and covid-19.
Looking further ahead, the effect of sanctions and buyer boycotts on large Russian-owned companies including Rusal and Evraz could have further implications for materials markets in many countries. Rusal, for example, produces 20% of the aluminium that can be sourced from outside China and has operations in Europe and the US as well as Russia.
It has been clear from the outset that the large-scale impacts of the conflict will be experienced differently in the various locations covered by the index. This analysis sets out to summarise how different regions will be affected by the conflict.
Europe and the UK
Europe in particular is set to be significantly affected. The region imports 40% of its gas and diesel oil from Russia. Europe also is the world’s largest steel import market, and over 10% of consumption is supported by steel sourced from Russia, Ukraine and Turkey.
Wholesale gas prices are now around three times higher than the long-term average and have fluctuated wildly since the war began. With the EU looking to stop oil imports from Russia, markets are likely to remain unstable. There is plenty of anecdotal evidence of manufacturers ceasing sub-economic production where this option is available, affecting the production of cement clinker, aluminium and some recycled steel products. The outlook in Europe is for materials shortages as well as higher prices.
Americas
The US construction market has a strong domestic component focused on basic and intermediate materials, but it is also highly dependent on imports from China, as sky-high container rates and long queues at West Coast ports have illustrated during 2021. The main exposure of the US to the impacts of the Ukraine war will be through the costs of energy, which typically follow the price of crude oil.
Gasoline, up in price by over 30% since mid-2021, has been a big driver of domestic inflation. This is likely to be exacerbated by the big hike in oil prices in March 2022. The US does, however, have its own domestic inflationary challenges. Timber prices, at $1,400 per cubic yard, are close to the all-time peak recorded in April 2021, as demand driven by an active housing market outstrips supply.
Middle East
Construction markets in the Gulf are quite dependent on public spending programmes, which tend to slow down when energy prices fall and to recover when prices spike. Although oil and gas production costs in the Gulf are quite low, governments need an oil price of $50 to $70 per barrel to be able to fund existing social and infrastructure programmes. The impact of low oil prices in 2020 caused by the pandemic was evident in relatively depressed construction markets in the region in 2021. With construction here unlikely to be exposed to the cost drivers associated the Ukraine crisis, the potential for increased public-sector workload supported by high energy prices is significant.
Asia
As a major source of raw construction materials, Asia will be exposed to commodity price inflation. Producers in the region may benefit from higher materials prices, but wider impacts, including high costs of the fuel subsidies common in the region as well as higher debt costs associated with the stronger US dollar, could weigh down on public expenditure.
Far more significant for construction markets in Asia than the Ukraine war is the potential slowdown of the Chinese property market. A reduction in development activity could result in a glut of materials in the region, reversing some of the inflationary pressure seen in 2021 in markets such as Singapore.
About the Construction Costs Index
The Arcadis international construction costs index offers a comparison of building costs across 100 global cities. The report provides regional construction markets insights and highlights examples of post-pandemic investment priorities in major cities around the world. This article includes data for 40 cities. The full report, published in April 2022, can be accessed via arcadis.com. The index is based on a survey of construction costs of 21 building types, based on local specifications and denominated in US dollars to enable comparison. The index compares the costs of delivering a building function in different locations rather than a like-for-like comparison of the costs of a similar type of work.
05 / Currency trends
Currency movement focused on an appreciating US dollar is an important component in the 2022 ICC rankings. The dollar weakened against a basket of currencies in 2021, in part due to the ultra-accommodative stance taken by the US Federal Reserve. The US reversed monetary policy faster than any other major economy and, unsurprisingly, the dollar strengthened – typically by around 5%. This is by no means a return to previous US dollar strength, as depreciation averaged around 12% in 2021.
The chart highlights the continuing weakness of the Japanese yen, which has hit the cost of imports even while bolstering the competitiveness of Japanese export markets.
Figure 2: US$ movement against other currencies, February 2021 to February 2022 (%)
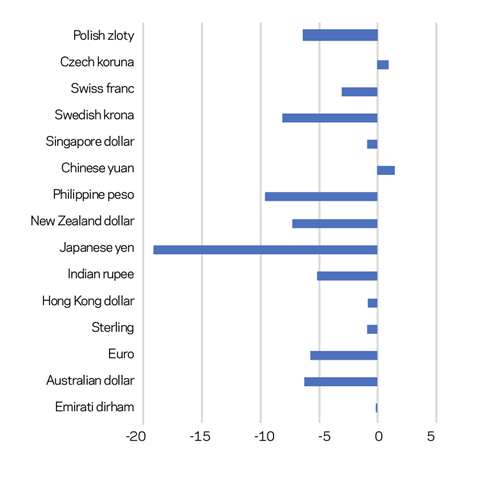
The most dramatic change seen this year has been the 50%-plus decline in the value of the Turkish lira against the US dollar. Combined with an inflation rate of over 50% and 25% interest rates, Turkey’s woes are a reminder of the potential for governments to lose control of their economies. This is a long-term crisis triggered in part by excessive overseas debt, a weak initial response to signs of inflation and even US sanctions. An austerity and transformation plan is now in place to address the crisis.
Sterling also appreciated against a basket of currencies during 2021. As a result, UK and US cities have tended to retain their positions in the ICC rankings. However, sterling has depreciated by over 8% since the beginning of the Ukraine war. The net effect is that US dollar-denominated investors have a competitive edge, which in turn will continue to support large investment transactions in sectors as diverse as logistics, later living and student accommodation.
In our basket of currencies, the Polish zloty has been particularly exposed to the impact of the Ukraine war, losing 11% of its value against the US dollar since February. The euro has depreciated by a further 8% and sterling by 8%. However, any currency change will not have offset the rise increase in materials prices that has taken place since late February.
06 / Commodities and energy prices
Rampant commodity price inflation explained at least some of the high construction cost inflation seen in 2021, and as highlighted in our section on the war in Ukraine, the outlook is for further turbulence in an increasingly complex market.
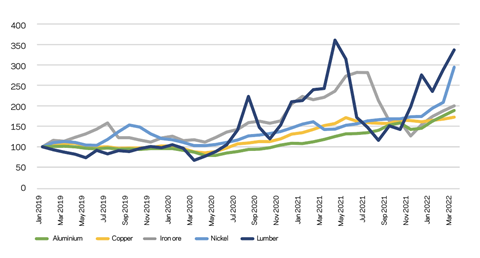
In nominal terms (without adjusting for inflation) metals were trading at historically high prices throughout 2021. Prices at this level have only previously been seen during the commodity price booms in 2007-08 and 2011-12.
The main explanation for the rapid increase in commodity prices in 2021 is simultaneous recovery. With manufacturing economies reopening around the globe, and with low raw material inventories in place, demand exceeded capacity to supply. This is seen most clearly in the price of US lumber in the top chart, where a combination of a high volume of housebuilding and growth in home improvement sent prices off the scale in second quarter of 2021. The effects of that price movement and others were felt around the world.
By contrast, Chinese moves to reduce carbon emissions by cutting steel production resulted in a 4% reduction in iron ore imports to 1.12 billion tonnes. This in turn triggered a 30% fall in global iron ore prices, which peaked at $215/tonne in July 2021.
Figure 3: Commodity price indices, 2019 to 2020
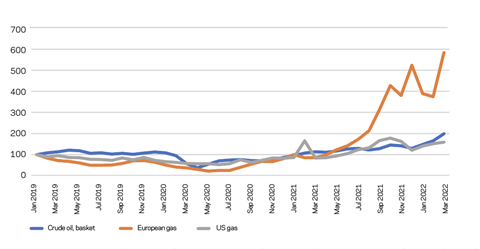
Energy prices took over as the principal driver of materials cost inflation in the second half of 2021. Even before the Ukraine war disrupted the market in Europe, supplies were tight.
Wholesale costs of electricity and gas in the UK are now three times higher than their historic trend. Prices in European markets may be even higher, due to constraints in the transfer of gas and electricity around the continent. The chart, however, shows that while spot prices are increasing in the US and other global markets, they are much lower than in the EU. Prior to the current crisis, power and heat costs accounted for 20% to 25% of the total costs of energy-intensive manufacturers. While some of these costs are hedged, at some point the full cost of energy will be passed through the supply chain, with significant implications for the European manufacturing supply chain. Producer price inflation in Germany, for example, hit 30% in March 2022.
The implications of high energy prices go beyond higher prices for manufacturers and consumers, particularly with respect to levels of production of basic materials in energy-intensive industries. Inventories of aluminium and zinc, which is an essential input for galvanising steel, have fallen by 30% in a month as producers have shut down loss-making facilities. Even with record commodity prices, cost of energy is too high to support production.
With high energy costs contributing to the increasing scarcity of key materials, the outlook in 2022 is for further price instability, which will make it even harder for manufacturers and contractors to offer price security to their clients.
Figure 4: Energy commodity price indices 2019 to 2022
07 / Conclusion
If the covid-19 pandemic highlighted the critical contribution that construction can make to an economy’s resilience and recovery, then 2021 has demonstrated that there are limits to how much construction can respond to the call to build back better before practical constraints associated with labour and materials kick in.
Although raw materials shortages and tight logistics have been the primary trigger for inflation over the past 12 months, it is clear that in many markets there is a skills constraint too. This is evident in Germany, which saw double-digit inflation in 2021, and also in Australia, where prices barely moved.
With clear signals of additional demand triggered by energy transition and backlog investment in aging infrastructure, activity levels are likely to be sustained – even if the private sector goes off the boil. This means that delivering more with less resources can be expected to be the defining challenge of the decade.
Clients and their project teams may find themselves fire-fighting this year as prices continue to increase as a result of materials price hikes. These teams also need to think long term about designing and delivering more efficient schemes – not only to reduce the carbon footprint, but also to make projects resource-fit in an increasingly competitive marketplace.
Acknowledgments
The authors would like to thank Agnieszka Krzyzaniak and our correspondents in Arcadis offices around the world for their contribution to the ICC survey.


No comments yet