


Construction output and sentiment have regained much ground after their collapse amid the initial lockdown, but ongoing uncertainty means recovery is wobbly. Michael Hubbard of Aecom reports
01 / Summary
Tender price index ▲
Tender prices remained broadly static over the 12 months to Q3 2020, with just a 0.6% increase. Downside risks to future trends are notably higher because of first and second wave pandemic effects, and Brexit in the new year.
Building cost index ▼
A composite measure of building input costs fell by 1.9% over the year at Q3 2020. Second quarter to third quarter changes showed a range of materials classifications increasing in cost though.
Consumer prices index ▲
The annual rate of change was 0.5% in September 2020. Enduring lockdown impacts contributed to lower consumer activity and demand.
02 / Output and new orders
UK construction output
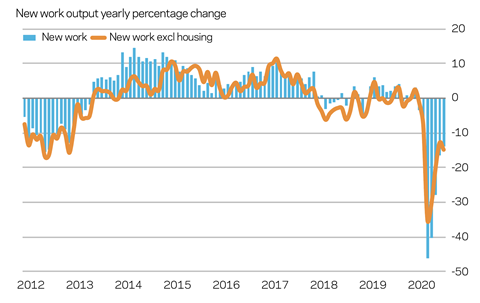
Construction output regained some momentum as more sites began to reopen fully around the middle of the year. Despite a slower rate of change more recently, optimism about expected 2021 workload remains in evidence across sections of the supply chain. Some contractors claim to have sizeable proportions of their 2021 order books secured already. The picture is not uniform, though, and varies in line with a firm’s exposure to particular sectors. Still, UK construction output has posted increasingly positive data points since the slump in Q2 2020. However, the rate of improvement is slowing, perhaps due to speed restrictions on current project progress, as well as emerging risks on future orders to replace existing workload.
The yearly rate of change for construction output is still negative at -13%, but that is a significant improvement from the low of -45.9% in April. This rebound in activity is relatively strong, given that the shutdown impact was so large. However, work backlog, employment outlook and underlying demand, once the V-shaped bounce-back dissipates, warn of downside risks further out. New orders bear this out, falling by 45% year-on-year at Q2 2020. This is the largest decline on record, surpassing the previous contemporary record fall of -38% yearly change in Q1 2009.
03 / Activity indicators
Business sentiment
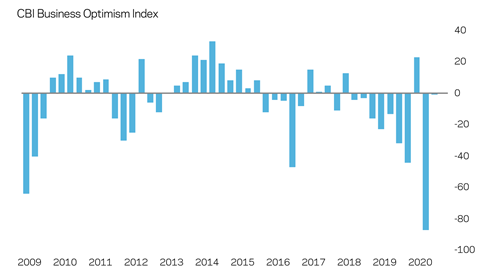
The UK’s GDP yearly growth rate fell precipitously to Q2 2020, posting its largest ever fall at -21.5% using contemporary records. The negative Q1 rate of change officially put the UK into recession. Subdued consumer sentiment was a strong theme during the lockdown period. Some improvement in service sector activity is evident, but there is a trade-off between social restrictions and this sector’s potential for economic activity. Many UK business sentiment indicators are back at or above their January level, before covid restrictions. The speed of bounce-back is remarkable at face value, given how far they slumped. Sentiment surveys should not be over-read though, because they typically reference the direction of change rather than its magnitude.
Construction activity relies on private sector confidence and its investment. Some projects have been paused because of the economic turbulence, and further impact on workload can be expected should uncertainty linger. Just as the economy started to find some momentum, impediments come from a second, renewed or increased phase of covid impacts and attendant societal restrictions through into 2021.
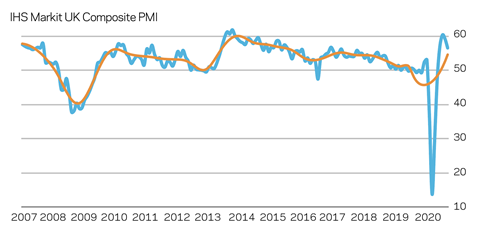
After strong rebounds, business sentiment surveys have struggled to maintain these initial highs. Most likely they are now reflective of slower moving but stronger economic undercurrents. At times of dislocation or extreme turning points, they can overreach and post data points that appear out of kilter with broader trends. Markit’s composite PMI – a measure of manufacturing and service sector activity – moved nearer to a neutral reading at 52.9 in October from a peak of almost 60 in August. Oddly, this recent peak was higher than anything recorded since mid-2013. Nevertheless, a number of business surveys are now moving into line with underlying economy trends. Risks remain that the medium term is patchier because of ongoing covid mitigations, along with Brexit added to the mix in the new year. The struggle then to maintain or improve economic activity as the coronavirus picture worsens makes the approaching winter potentially more discontenting.
04 / Building costs
Inputs
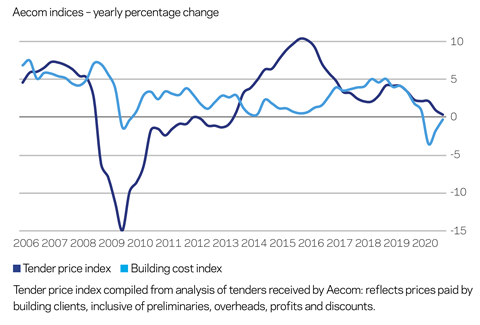
Aecom’s composite index for building costs – comprised of materials and labour inputs – fell by 1.9% over the year to Q3 2020. However, a significant majority of materials classifications in the index showed an increase in cost, or no change, from Q2. These quarterly increases are in response to a combination of ongoing demand from work predating lockdown, restart demand spikes and low supply inventories.
Similarly, wages increased strongly between the quarters, as demand for labour returned with site activity – but unevenly across disciplines. Although there was a solid rally towards the mid-point of the year, aggregate wages levels have not yet returned to their pre-pandemic peak. Ongoing downside pressure on wages is likely while replacement workload is more sluggish to come through, though in the near term, there are offsetting factors from restricted workforce availability.
Changes to tender price trends leaves the supply chain in something of a growing quandary. Input costs continue to rise but there is increasingly limited headroom to secure a commensurate rise in prices. Clearly, the extent to which this continues will be linked to new orders and levels of supply chain competition. These dynamics, in turn, will be directly related to broader economic risks – whether from coronavirus, economic sluggishness, or Brexit.
05 / Tender prices
Resources
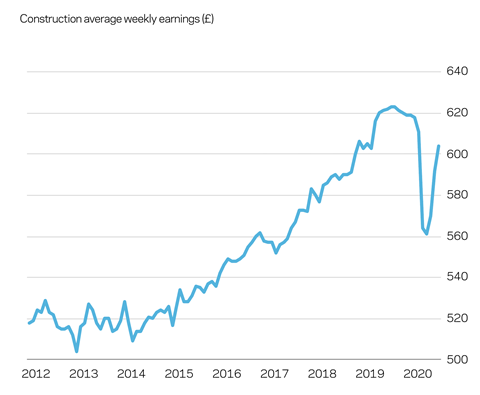
Tender prices topped out in Q2 2020, with only a 0.6% rise over the preceding 12 months. Perhaps the bigger story is the 0.5% fall between Q2 and Q3. Does this quarter-to-quarter decline signal the start of a trend reversal, particularly in view of the external risks? Prices have risen continuously for almost seven years, so any change to this trend is significant, even if in the most optimistic of views it turns out to be a short interlude in the trend. In 2008, it was not until Q3 or Q4 that falling prices were confirmed, such is the time lag between macroeconomic events and visible changes to tender pricing.
The current equation for contractors on pricing dynamics bears some similarity to 2008. Do firms now hold or trim prices slightly, in the face of more uncertainty? Are prices or other commercial elements reduced notably to secure workload? The pressure to absorb some items within other cost elements grows in the face of higher competition. But profound questions now arise as to whether more firms will, or need to, join this shift in market sentiment – either to apply more competitive pricing on a limited and specific number of projects to complete the 2021 order book, or, where there are fundamental holes in the 2021 workload, adopt a substantially different tactical pricing approach. The risk to the overall pricing environment is that a subtle shift in market sentiment becomes a steady procession, as more firms feel the need to join the fray. Another interesting market development is the return of commercial adjustments or discounts – usually one-line adjustments or notable percentage discounts. This is certainly a signal that the market is experiencing higher levels of competition.
05 / Outlook
TPI forecast
A pandemic second wave – or perhaps even a continuation of the first wave, in some parts of the UK – will introduce renewed risks for the construction sector. Corresponding restrictions across the economy more broadly are likely to have implications for new orders. In turn, commercial positioning and tender pricing will inevitably flex in response to available new work. The balance between market share, or turnover, and tender pricing is now moving to front and centre for a greater proportion of the supply chain. Should volume be secured at sub-optimal prices, or should better pricing be applied, which risks ending up with sub‑optimal volume?
Public sector workload is increasingly seen as a source of steadier workload over the next 12 to 24 months. Those contractors that spent time over the last few years reshaping, rebalancing or reorientating their portfolio or business lines towards higher levels of public sector work appear more bullish now on their order books well into 2021. Those without this focus or with a balanced portfolio are likely to find themselves in more of a bind, as uncertainty increases in private sector areas of the economy. Compounding matters, private sector workload accounts for a significantly larger percentage of overall construction output.
A discernible V-shaped rebound in sentiment has taken place since Q2 2020, bouncing back higher than its pre-lockdown levels. The tandem data series for recorded economic activity has plotted a more abstract, part-V shape. Furthermore, it lies still some way below its level immediately before the pandemic. At just the wrong time, economic activity will run into headwinds from the so-called second wave of the pandemic and then Brexit at the end of 2020. External events and factors are playing an increasingly larger element in outlook and associated planning.
In 2021 the sector will need to adapt to profound changes in supply chains: both in their operation and in the goods, materials and components that these supply chains make available in the UK. Even if a free-trade deal with the EU is agreed, meaning zero tariffs for the most part, very substantial changes will still result from non-tariff barriers. Essentially this means much more red tape and significantly higher levels of friction to trade with the EU. These non-tariff barriers will introduce significant inflationary pressures – in terms of both cost and time – for the whole direct and indirect supply chain. Along with the requirement to navigate bumpier terrain over the next 12 to 24 months, the germane question is how and where the costs and risks associated with non-tariff barriers are absorbed across the supply chain and, ultimately, who ends up paying for them.
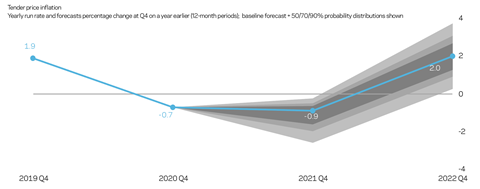
Aecom’s baseline scenario sees a slower economic recovery after the initial V-shaped sentiment rebound. A corresponding V-shaped economic recovery is now unlikely, especially with Brexit looming. Aecom has modelled other scenarios, but the baseline scenario shown below is now the most likely.
Baseline scenario: slower recovery after initial V-shaped sentiment rebound
Outline:
- Early sentiment and activity spike fades as weaker economic trends emerge.
- Monitoring and suppression is the over-arching approach as lockdown severity eases, but the potential remains for further country-wide or localised lockdowns where necessary.
- Construction output does not return to similar levels to those immediately prior to the coronavirus outbreak until 2021 at the earliest.
- Broader economic disruption is sufficiently large that related construction demand, either directly or indirectly, is notably impacted.
- Operational and productivity impacts continue from social distancing, monitoring and suppression mitigations.
Effects and outcomes:
- Input costs maintain long-run average or above-average yearly rates of change, because of supply constraints and exchange rate fluctuations.
- Reduced supply chain capacity, either through insolvencies or restrictions on delivery capability, is a significant offsetting factor that applies upside risk to tender prices.
- Tender prices experience downside pressure over the short term due to restrictions on activity, lower output and some knock-on effects to overall demand. For similar reasons, supply-side effects produce some upside risk but overall tension for the supply chain to win work and secure cash leads to competitive tendering – and possibly even subeconomic pricing in some instances.
- In this scenario, tender prices are forecast to decline by just under 1% over the 12 months to Q4 2021. Given the levels of prevailing uncertainty, attention should be paid to the range of possible outcomes that the confidence intervals represent on the fan chart.


No comments yet