


New work output saw a little expansion in Q2, but, year-on-year, new orders slipped after a minor rebound in Q1 as Brexit uncertainty continues to make itself felt. Michael Hubbard of Aecom reports
01 / Summary
Tender price index ▲
Tender prices increased by 2.8% over the year at Q3 2019. Commercial supply chain pressures moved prices higher annually, but now with less speed on a quarter-to-quarter basis.
Building cost index ▲
A composite measure of building input costs recorded a 3.5% yearly rate of change in Q3 2019. Input costs are expected to continue rising but at a marginally slower rate.
Consumer prices index ▲
The annual rate of change slipped to 1.7% in September 2019. This is below the Bank of England’s target of 2% and the lowest rate since late 2016.
02 / Output and new orders
UK construction output
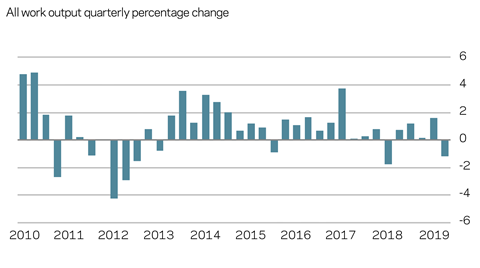
Headline construction new work output posted a modicum of growth in Q2 measured year-on-year. It is expansion all the same, and positive news is reassuring to offset uncertainty elsewhere. However, the annual rate of change in growth was slower than that posted in Q1 2019 by a factor of almost a half. Additionally, the quarter-on-quarter change was negative, meaning a slowing of output expansion in Q2 versus Q1.
A more nuanced story lies beneath the headline change rates. Public housing and infrastructure sectors have the highest rate of change in recorded new work output at Q2. Public housing is a comparatively small sector though. On the other hand, infrastructure is a major sector for workload, comprising broadly 20% of industry workload. Changes here are usually material to overall industry output, and with the potential to offset declines in other sectors. Coincidentally or not, public sector and infrastructure output has always increased notably before general elections.
New orders
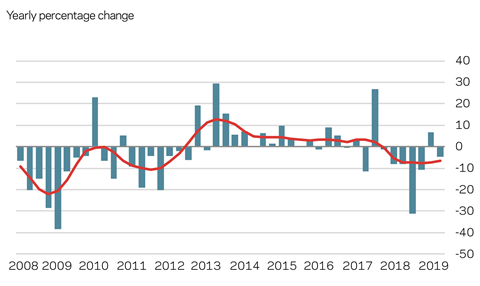
New orders for new work slipped in Q2 after a minor rebound posted in Q1. The Q1 uptick should provide a fillip even though the equivalent data points through 2018 still loom on the chart. The question of what these data points mean for output later this year and into 2020 remains. Projects on hold as a result of Brexit uncertainty account for some of this hiatus in the new orders time series data set. Any resolution to the UK’s political situation can only offer more clarity in which to assess the merits of proceeding with projects.
Additional impetus to workloads might follow as a result of the release of held projects. However, the size of this “Brexit bounce” will be influenced by the final outcome and the nature of accompanying economic fundamentals. Infrastructure led the sectors in size of new orders growth. Non-housing public sector work also recorded positive yearly change. However, all other sectors posted declines year-on-year and quarter-on-quarter.
03 / Activity indicators
Business sentiment
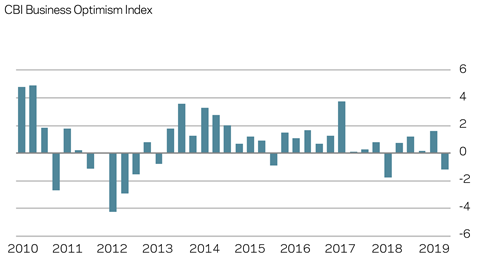
UK business sentiment is displaying clear signs of fatigue from political and economic uncertainty – even perhaps confusion. Optimism is in shorter supply. The CBI’s business optimism index reading for Q3 2019 is significant: only one reading lower than this has been posted since the financial crisis – immediately after the 2016 EU referendum. The CBI reports ongoing weakness in investment plans and weaker prospects for exports. A resolution to Brexit ought to lift some of the fog.
The international macroeconomic picture offers only slightly more clarity. But the proportion of respondees citing political and economic conditions abroad as an impediment to export orders was a survey high. Similar trends are evident in other advanced European economies. Profit warnings have increased across all UK industry sectors. “Challenging global environment”, “deterioration in trading conditions” and “weak underlying demand fundamentals” have all been recently cited as reasons for a poorer or lower level of financial performance.
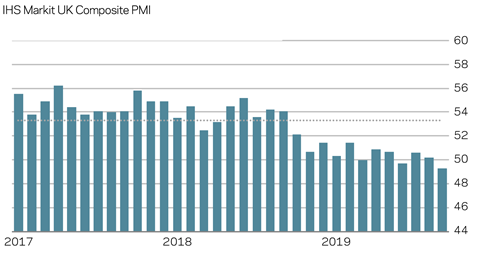
With a flat GDP run-rate, lukewarm at best is a fair assessment of the UK’s economic confidence. All business confidence surveys point to Brexit as the overwhelming issue casting a shadow. The construction supply chain is no different, and it will be increasingly scrutinised as a reason – if not the reason – for a patchier outlook into the medium-term. A stockpiling push in early Q3 helped trading and economic activity UK-wide. This was not to the same extent as in Q1 2019 and the first Brexit deadline. For now, the UK has avoided the prospect of a no-deal Brexit.
Despite everything, perhaps the most surprising thing is that UK GDP has shown such resilience. Without doubt, Brexit is a handbrake to activity. The question is whether UK GDP is developing a slow puncture as a result. Spillover into construction is inevitable from broader economic drivers. However, a return to a long-run average for output would be a welcome outcome, dodging the worst of any market cycle readjustment.
04 / Building costs
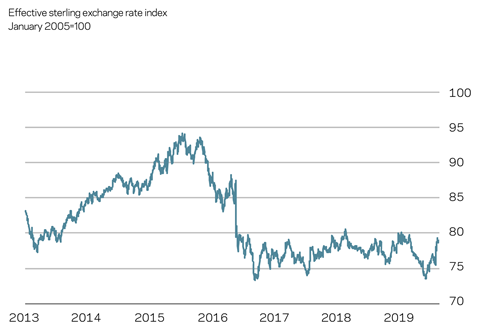
Sterling’s path over the last 18 months is inextricably linked to Brexit. Overwhelmingly, the rising and falling likelihood of “no deal” at various points drove the larger movements. A trade-weighted sterling index was still within the range plotted since 2016, albeit now at the top of this band in response to some Brexit deal-related optimism. Had a no-deal exit occurred in October, it is likely sterling would have weakened considerably further. Increased building materials costs, as a result of currency movements, would not alleviate current commercial tensions within the supply chain though.
Direct cost impacts have been the primary focus of attention in the last year when assessing Brexit effects. Tariffs are the headline consideration, but currency changes are equally significant. Nevertheless, post-Brexit, additional friction from non-tariff barriers at UK borders is likely to become a considerably larger factor in the management and delivery of construction projects where materials and components are imported.
Inputs
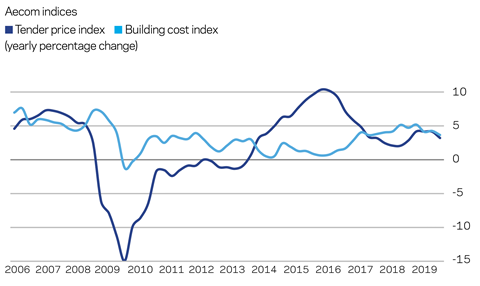
Aecom’s composite index for building costs – comprised of materials and labour inputs – rose by 3.5% over the year at Q3 2019. Most of the supply chain held the view until recently that materials and labour costs will increase further to the end of 2019. Some weakening of this view is evident now on the back of marginally slower yearly growth in materials costs. Existing workload, planning for next projects and some challenges securing trade resources will keep the commercial squeeze, albeit with slightly less intensity.
There are upside risks to input costs from the type of exit that the UK makes from the EU. Expect lower sterling in the event of a disruptive exit, and eventual higher materials and components prices, all other things being equal. Conversely, a “softer” Brexit – or no Brexit at all – will likely see sterling rally, strengthening against the euro and US dollar, which should ease some of the headline cost pressure on imported materials. In turn, forecasts of input cost inflation over the remainder of 2019 and into 2020 are at a lower headline rate of broadly 3%. But this assumes a less disruptive EU exit.
05 / Tender prices
Resources
Supply chain capacity across the UK construction industry opened up through 2019. Movement in capacity measures is expected in response to adjustments in overall sentiment, activity and output. However, the softer capacity constraint theme picked up pace somewhat as 2019 played out. This said, the measure is similar to that seen in 2016 shortly after the EU referendum. Recruitment for non-site skills and disciplines softened too, but without going into outright reverse. A pause here can be expected and correlates directly with the broader period of slower economic activity across the UK economy.
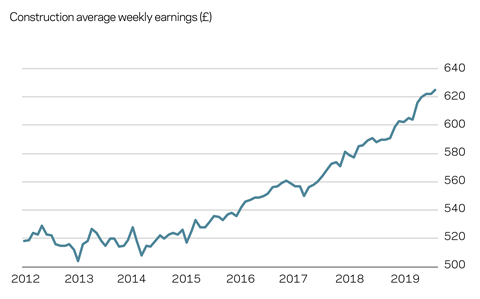
Changes in capacity utilisation measures are filtering into labour wage trends. An aggregate measure of wage rates for site labour increased by just under 3% annually. This is noticeably softer wage growth than that seen earlier in 2019, when it ranged between 4% and 6% year-on-year. Despite being marginally slower, the trend remains above measures of general price inflation in the UK. For now, the construction sector therefore maintains its stronger real-terms wage growth.
TPI forecast
Tender prices increased by 2.8% over the year at Q3 2019. The principal drivers of price inflation remain in place, but with softer underlying trends. Pricing flow-through from the supply chain, input costs (labour and materials) and some necessary risk allowances are all still in play as drivers of inflation. Notably, preliminaries are lower over 2019. Quite often preliminaries and indirect cost items are an earlier indicator of changes to underlying price dynamics and commercial sentiment.
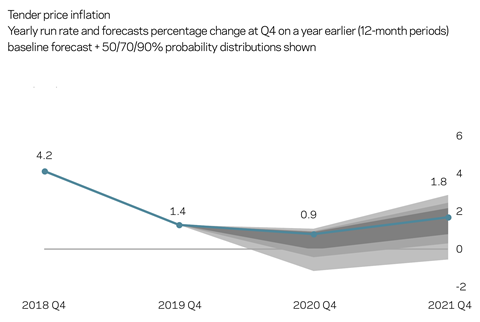
Aecom’s baseline forecasts for tender price inflation are 0.9% from Q4 2019 to Q4 2020, and then 1.8% from Q4 2020 to Q4 2021. Downside skew accompanying the forecasts is noticeably higher across the period. Assumptions underpinning the forecasts include output reverting to somewhere near a long-run average without excessive volatility; input costs higher than the general rate of consumer price inflation; and an orderly exit of the UK from the EU that generates some upside risks from a synchronised release of held projects.


No comments yet