


Strong growth in central London’s office market is now driving developers to look to locations they may not previously have considered, while also being concerned to provide buildings adapted to occupiers’ present and future needs, report Alastair Kenyon, Mat Burgers and Brian Smith of Aecom
01 / The Central London office market
Demand for offices in the central London market is growing apace with the impact of the 2008 recession long behind it. With the population of London now back to pre-war highs of 8.6 million people and projected to reach 10 million by 2030, and up to 13 million beyond that, according to the Greater London Authority, the demand for office space continues and new locations are needed.
Current trends have seen business confidence increasing and record employment growth driving the takeup of office space to 3.7 million ft2 in Q2 15, according to Jones Lang LaSalle, making the takeup in the first half of 2015 the strongest since 2001. This has resulted in the vacancy rates in central London approaching record lows. There was a similar trend in Deloitte Real Estate’s “crane survey” for summer 2015, which found office construction up by 24% over the past six months to 9.5 million ft2. Deloitte found 31 schemes started on site in the period, the second-highest total in 20 years, and 37% of space under construction had been pre-let.
Significantly for future market trends, the technology, media and telecommunications sector took nearly half of what was available with a new generation of companies taking space and looking for a different type of office product.
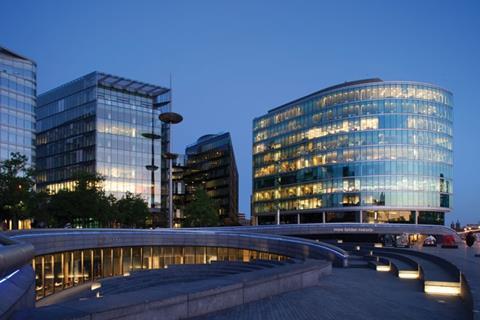
This growth is happening not only in the traditional office districts of the City of London and the West End but in areas previously seen as fringe such as Southwark, Paddington, King’s Cross and Shoreditch, with developers looking at other London locations when opportunities present themselves. There is a clear strategy from some of the UK’s more established developers not to compete for high priced, traditional locations, but to identify others where better value can be created.
With the continued development in infrastructure, these new areas outside central London are being seen by developers as such opportunity areas. In the immediate future areas around Crossrail stations at Paddington, Bond Street, Tottenham Court Road, Farringdon, Liverpool Street and Whitechapel will become attractive (or indeed even more attractive) development opportunities and the catchment from which central London employers can recruit employees will expand considerably.
Other potential infrastructure projects, such as Crossrail 2, HS2 and the Northern line extension will continue to expand the traditional areas, particularly around transport hubs in these areas of redevelopment.
02 / Demand for a different kind of office
While the central London office market grows, demand is changing both with improvements in construction technology and because the spaces need to differ from those of the past.
Developers are targeting the perceived preference for buildings with high floor-to-ceiling dimensions, natural daylight and flexibility in the shell to respond to different cooling and heating strategies.
Occupiers want low-energy buildings, which is also a factor for developers who retain their assets and want to reduce running costs over a life cycle.
Working lifestyles are changing
Office buildings more than ever are being designed around the demands of potential workforces. Working lives have changed radically in recent years with increased use of practices such as hot desking and remote working, facilitated by better IT infrastructure and equipment.
If a developer has a pre-let then they know the shape of the incoming workforce, but more often they must think from the outset about the kind of occupier they want to attract, which in turn will depend on the building’s size and location.
Occupiers demands might, for example, include provision of cycle parking facilities, which is no longer seen as a tick box for BREEAM ratings by developers, but more a boost to access and welfare provisions, to help occupiers attract and retain best-in-class staff. Likewise, the demand for communal space by occupiers is seen as an opportunity to create well-designed buildings with attractive outside space such as roof terraces, along with options to provide kitchen facilities.
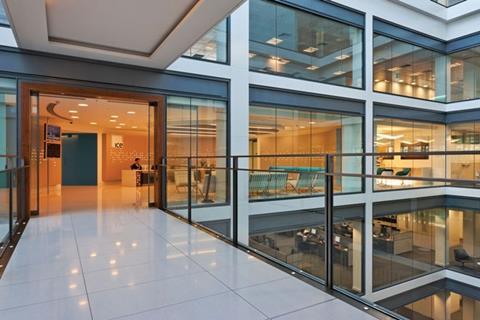
An evolving place of work
Modern companies demand more open plan space, breakout areas, recreational facilities and want to use space differently as they grow. It has become common for developers to respond to the need of flexibility in the workplace by providing dedicated riser/plant space or a base build readily adaptable to meet requirements, such as soft spots in floor slabs to enable the introduction of staircases.
The range of design solutions for the office space is increasing, with more schemes opting for exposed soffits and services rather than traditional suspended ceiling. While there is an initial saving in capital cost by omitting the ceiling, the developer or occupier may demand a high standard of concrete finish and the additional coordination of exposed services and material selection must be considered, which can result in these solutions being more expensive.
More buildings now use their frame to help with heating and cooling. With the critical mass needed, these buildings tend to be concrete framed, with exposed ceilings and cores.
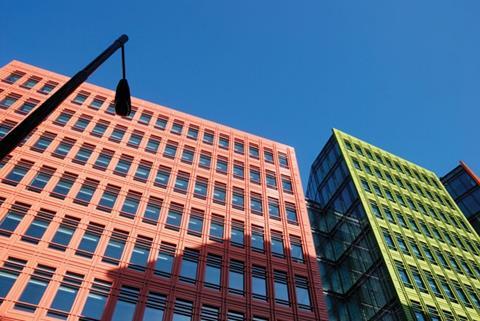
A sense of place
Newer locations often have different specifications from the traditional office markets of the City and West End, driven both by cost and the desire for a different look and feel.
Many developers value the possibility of creating a new hub at sites with good infrastructure links where over time other projects will be built, so benefiting from the effects of agglomeration of office developments and other uses such as residential, retail and leisure.
Large developers are looking to create places rather than individual buildings, with substantial mixed use projects in hand such as Argent’s King’s Cross, British Land’s Regent’s Place and Land Securities’ Nova Victoria.
Traditionally, office developments are devoted only to office space, with a small amount of retail element at ground floor in the City and West End, but more are being considered with other uses in mind to create an environment that attracts occupiers. Publicly accessible sky terraces and bars, for example, are a popular way of creating destinations.
03 / Design responses to new demands
Not all businesses want high ceilings and vast open plan spaces and developers must also respond to the demands of occupiers which may be start-ups when moving into the building, but who could grow and be retained as a tenant.
Creating low-cost entry level office buildings is one solution, so that potential high growth companies move into low capital cost incubator spaces, with corresponding low-level rents, but with the design of the building being inherently flexible to change and adapt as an organisation grows.
Differing densities
The prevalence of hot desking and remote working means not everyone needs be in an office throughout traditional working hours, so densities can increase to accommodate peak demands.
Ratios of one person per 8-10 square metres of net lettable space are becoming more common than the 10-12 levels seen in the past.
The British Council for Offices’ (BCO) Occupier Density Study in 2013 found that as flexible work styles continue to spread, typical space budgets within buildings are changing.
In the past, a typical office building would comprise 80% fixed workplaces, 15% meeting space and 5% support space, but today’s typical office is far more dynamic with a greater variety of workstation settings in a smaller proportion of the overall space and with more meeting and informal break out space provided.
The BCO report also found there was a tendency among developers to cater for the highest densities across the whole space, providing for the “worst-case scenario”, but consideration should be given to accepting buildings that can respond to changing occupier needs over time, by enabling them to adapt to specific increased demands on building services. Developers are responding to this by designing buildings with the ability to cater for increased demands on certain floor levels or a proportion of the overall lettable space. In addition, future demands on plant, WCs, lifts and stairs are being considered from the outset, so again the building can be readily adapted to meet increases in density.
Spatial requirements
When developers are competing for occupiers they will try to offer attractive features such as roof terraces and areas where large gatherings can take place, such as open plan column free auditorium space, for example.
This will attract more cost, as roof terraces need their own access and welfare provisions and auditorium space usually requires additional access/egress and security arrangements, which may impact on net areas along with the cost of the transfer structures to create these spaces. However, many developers often feel this is a price worth paying to distinguish their product.
Meeting occupiers’ desires for increased floor-to-ceiling heights may mean increasing slab-to-slab heights to 4m, from typical standards of 3.6m. For buildings over about 10 storeys this may mean sacrificing additional floor space to accommodate this additional floor height, but again the cost and value conundrum will need to be evaluated to inform this decision.
An alternative means to maximise clear ceilings heights is the use of chilled ceiling products, which provides a reduced servicing zone compared with fan coil units, but whose performance must be assessed to avoid the need for additional perimeter heating and cooling to meet peak demands.
Openable windows tend to be popular with office workers but have implications for the efficacy of air conditioning and external noise and air pollution. They may also make a facade most costly and practical implications of how internal/external blinds will be affected and potential impact on lettable floor areas also needs to be considered.
MEP design
The question of whether primary plant is located at roof or basement level will depend on whether any other use is planned for a roof, whether the plant concerned works better from a high or low level and the cost of constructing the basement. Other factors to consider are the flexibility of generator space, back-up supplies and cooling capacity needed for buildings that grow with their occupiers.
In addition, speculative developers are now considering, or are already installing, the backbone fibre infrastructure through the vertical cores so tenants can utilise this on a floor-by-floor basis.
This enables the developer to manage the prospective tenants’ requirements early in the design process to maximise flexibility and security.
In regard to security, occupiers tend to prefer buildings that are secure without resembling fortresses, with fewer bollards and security gates. Alternative measures such as face recognition, smart phone apps and less obtrusive CCTV are all options to allow a building to feel welcoming and open without compromising security.
Lifting solutions with destination hall control is becoming standard as developers and designers drive to develop efficient lifting solutions while increasing the occupational densities. LED lighting to category A areas is also becoming a standard specification.
04 / Construction and cost drivers
Pricing levels and workload
The recovery in the commercial market combined with other sectors in London, means prices are now back to the market peak of 2008.
This recovery has led to capacity constraints. Tier 1 subcontractors and main contractors are now able to be selective about the schemes on which they work, with Aecom’s trade survey this summer showing, on average, two-thirds of respondents had their turnover for the year ahead secured, though this varied from 52% among piling contractors to 80% for joinery.
Fully, 96% of respondents said tendering activity had increased over the year and – with an increased number of invitations to tender – had felt able to decline 33% of them.
When pricing a tender, the trades’ own supply chain was the biggest influence.
Skills shortages were affecting contractors’ capacity, with concrete, mechanical, electrical, building management systems, fire alarms, sprinklers, WC fit-out and joinery showing problems.
Potential import price threats
Although prices have recovered, the relative weakness in the euro has kept the cost of imported components artificially low. If and when the euro strengthens will be a driver for inflation. This principally impacts on the facades and curtain walling package as a significant number are manufactured in central Europe, although the emergence over the past decade of Far Eastern companies as a genuine alternative may mitigate this to a degree. Lifts and primary plant such as switchboards, chillers and generators are often sourced from Italy and Spain and so face a similar cost threat.
Procurement routes
A further impact of the recovering market is the need for clients to amend the procurement routes. With main and trade contractors able to be selective there has been a move away from single-stage lump sum tendering back towards two-stage and selective negotiating of contracts. Contractors’ management costs, margins and risk transfer have also recovered from post-recession lows and are one of the key drivers for rates being back to 2008 levels.
Site constraints
The need to respect surrounding buildings and the environment, along with the congested nature of some locations and individual site constraints will influence the key commercial aspects of a development. The shape, size and volume are a key driver for determining the metrics of wall-to-floor ratio and net-to-gross efficiency. Larger, simpler sites allow for more efficient shapes to be developed, which have a direct impact on the cost of structures and facades, helping to drive overall lower construction costs for these sites.
Utilities infrastructure
With the current volume of commercial office development in central London, it is advisable to engage with the statutory utilities at the earliest opportunity.
Of particular importance is early engagement with UK power networks, the incumbent electrical distribution network operator.
Electrical connections in the City have to be planned well in advance as it is common for the point of connection for a power supply to be a fair distance away from the point of use.
To install cabling through the streets of London requires planning in advance and can be very expensive to deliver. It is worthy of note that while the majority of large building connections are provided at 11,000 volts, UK power networks now offer certain large development projects within the City to be connected at 33,000 volts.
This will have an effect on the overall connection arrangement and cost (ie the transformer provisions are much larger within the buildings itself and the capital cost is significantly higher).
05 / Central london cost model
The cost model is based on a typical central London office scheme arranged over 10 floors above ground and one basement floor. It has a gross internal floor area of 25,000m2 with a net-to-gross efficiency of 72% and a wall-to-floor ratio of 0.45. It complies with Part L 2014 and achieves a BREEAM 2014 rating of “excellent”. Occupational density of the office space has been assumed to be 1:8.
Costs are base dated at Q3 2015 and the model reflects prices obtained from a competitive tender through a two-stage tender process converted to a lump sum contract. The cost model includes all main contractor preliminaries, fees and risk allowance to complete the building to Category A standard. Demolitions, site preparation, external works and services, fit-out beyond Category A standard, tenant enhancements, professional fees and VAT are excluded.
Alternative office design
The base cost model is based on a steel frame building, with a traditional four-pipe fan coil unit system and a metal tile suspended ceiling. The growth of the market outside traditional areas has seen the development of alternative designs which influence the capital cost of the systems installed.
The majority of these alternative designs expose the soffit of the slab and the services, with options on what type of services strategy is to be adopted, such as fan coil units, chilled mat and ceilings and chilled beams, for example.
On a four-pipe exposed fan coil solution, the range from a very basic industrial look to a highly enhanced aesthetic solution will have a significant bearing on cost. The impact on the base build model for this solution is between £0 and £5/ft2.
Chilled ceiling air conditioning with its various design solutions has been widely used in Europe for many years but has not been developed in the UK to the same extent.
There is currently a market shift (particularly in London ) towards this, where developers are market testing the various design options against the traditional fan coil design.
Occupancy density, floor-to-ceiling height limitations, product cooling output, zoning parameters, size and shape of the floor plate, selection of cladding type and many other factors influence the overall capital cost in a cost appraisal. For a central London office development this would provide an addition to the base cost model of between £5/ft2 and £15/ft2.

Learn more about this topic at the ‘Future of commercial development’ session at this year’s Building Live event on 26 November. For more information and to book tickets go to: www.building-live.co.uk/programme
06 / Cost model
| Total (£) | £/m2 | % | |
|---|---|---|---|
| SHELL & CORE WORKS | |||
| Demolitions / alterations / site clearance | Excluded | ||
| Substructure | 4,372,000 | 174.88 | 7.5 |
| Allowance for de-watering excavations | 250,000 | 1 unit | |
| Break out existing slabs, piles, obstructions and allowance for probing/testing | 500,000 | 1 unit | |
| Foundations; bored piles 600-1,500mm diameter, 15-20m long, ground beams, pile caps | 860,000 | 400 (2,150 units) | |
| Allowance for mini piles and other works to boundary walls | 300,000 | 1 unit | |
| Allowance for piling platform and access ramp | 50,000 | 1 unit | |
| RC basement slab 300mm thick, including waterproofing, excavation and disposal | 537,500 | 250 (2,150 units) | |
| RC mat slab 1,200mm thick, including waterproofing, excavation and disposal | 150,000 | 600 (250 units) | |
| Reinforced concrete retaining walls, 300mm; temp supports | 352,000 | 320 (1,100 units) | |
| Reinforced concrete ground-floor slab 130mm thick on profiled metal sheet decking | 322,500 | 150 (2,150 units) | |
| Allowance for lift /escalator pits, sumps, thickenings to stair foundations, construction joints between new / existing work, drainage channels, concrete transfer walls, etc | 350,000 | 1 unit | |
| Allowance for crane base including base piles | 50,000 | 1 unit | |
| Attendance on archaeologists and movement monitoring | 100,000 | 1 unit | |
| Allowance for below slab drainage | 350,000 | 1 unit | |
| Allowance for all other items and sundries | 200,000 | 1 unit | |
| Frame | 6,274,863 | 250.99 | 10.7 |
| Structural steel frame, based on 80kg/m2 overall of GIA including fittings. | 3,656,000 | 2,000 (1,828 units) | |
| Allowance for secondary steelwork, based on extra 5kg/m2 | 285,625 | 2,500 (114.25 units) | |
| Extra for concrete encased beams at ground floors | 75,000 | 1 unit | |
| Fire protection to steel frame (average rate but generally 90 mins intumescent paint) | 1,068,238 | 550 (1,942 units) | |
| Reinforced concrete core walls (avg 350mm thick) | 990,000 | 300 (3,300 units) | |
| Allowance for other structures (eg, lift motor rooms) | 150,000 | 1 unit | |
| Allowance for expansion joints and other sundries | 50,000 | 1 unit | |
| Upper floors | 1,905,850 | 76.23 | 3.3 |
| Lightweight reinforced concrete 130mm thick on profiled steel decking | 1,655,850 | 95 (17,430 units) | |
| Allowance for upstands, plinths, bund walls, metal plate walkways, supports, etc | 250,000 | 1 unit | |
| Roof | 1,081,000 | 43.24 | 1.9 |
| Lightweight reinforced concrete 200mm thick on profile steel decking | 308,000 | 140 (2,200 units) | |
| Proprietary roof finish, paving slabs, insulation and ballast | 440,000 | 200 (2,200 units) | |
| EO to last for green roof | 88,000 | 200 (440 units) | |
| Allowance for insulation to exposed soffits and acoustic treatment | 60,000 | 1 unit | |
| Allowance for upstands to perimeter/terraces | 110,000 | 500 (220 units) | |
| Allowance for plinths, hatches/ladders, safety hooks and latchways | 75,000 | 1 unit | |
| Stairs | 540,000 | 21.6 | 0.9 |
| Steel pan stair cases including concrete infills to stair treads, painted mild steel balustrades and handrails (basement to roof) | 360,000 | 1 unit | |
| Ditto, basement to ground: two flights | 30,000 | 15,000 (2 units) | |
| Feature entrance stairs | 100,000 | 1 unit | |
| Allowance for stairs/cat ladders and safety rails to plant rooms | 50,000 | 1 unit | |
| External walls | 11,010,350 | 440.41 | 18.9 |
| Unitised curtain walling system with solid spandrel panels and high performance glass | 9,151,350 | 950 (9,633 units) | |
| External structurally glazed wall to entrance lobby | 240,000 | 1,200 (200 units) | |
| Glazed screen to retail shopfronts | 84,000 | 1,200 (70 units) | |
| Aluminium screening to plant enclosures | 270,000 | 600 (450 units) | |
| Glass entrance canopies; cantilevered from building | 375,000 | 1,500 (250 units) | |
| Extra for louvres | 75,000 | 1 unit | |
| Blockwork at roof level, including wind posts | 15,000 | 150 (100 units) | |
| Allowance for visual mock-ups and performance tests | 300,000 | 1 unit | |
| Allowance for facade cleaning equipment | 500,000 | 1 unit | |
| Windows and external doors | 230,000 | 9.2 | 0.4 |
| Extra over cladding for single and double doors, including disabled pass doors. | 25,000 | 1 unit | |
| Extra over cladding for revolving doors. | 150,000 | 75,000 (2 units) | |
| Electrically operated galvanised steel roller shutter to loading bay and car park ramp | 25,000 | 1 unit | |
| Metal doors in service areas | 30,000 | 1 unit | |
| Internal walls and partitions | 2,119,500 | 84.78 | 3.6 |
| Fairfaced blockwork walls at basement, ground levels and roof levels | 600,000 | 150 (4,000 units) | |
| Curved blockwork entrance feature wall | 60,000 | 200 (300 units) | |
| Drylined core walls. | 764,500 | 110 (6,950 units) | |
| Extra for double thickness drylined core walls. | 110,000 | 110 (1,000 units) | |
| Allowance for other walls/partitions to plant areas, additional walls and detailing. | 180,000 | 1 unit | |
| Veneer-faced WC cubicles/doors; access panelling | 405,000 | 4,500 (90 units) | |
| Internal doors | 544,000 | 21.76 | 0.9 |
| Single timber doors | 304,000 | 1,900 (160 units) | |
| Double timber doors | 90,000 | 3,000 (30 units) | |
| Profilex riser doors | 75,000 | 1,500 (50 units) | |
| Other doors; plant rooms, additional access door hatches | 75,000 | 1 unit | |
| Wall finishes | 1,212,800 | 48.51 | 2.1 |
| Stone cladding to main entrance lobby. | 352,000 | 400 (880 units) | |
| Feature wall panelling on steel frame in main entrance lobby | 165,000 | 1,100 (150 units) | |
| Paint to fair face block walls | 21,500 | 10 (2,150 units) | |
| Plaster and paint to blockwork/concrete | 76,400 | 20 (3,820 units) | |
| Skim coat and paint to drylined walls | 20,400 | 12 (1,700 units) | |
| Stone cladding to toilets | 157,500 | 350 (450 units) | |
| Granite cladding to lift lobbies | 320,000 | 400 (800 units) | |
| Lift architraves | 100,000 | 1 unit | |
| Floor finishes | 957,400 | 38.3 | 1.6 |
| Floor finish to main entrance lobby and lift lobbies | 500,000 | 400 (1,250 units) | |
| Stone tiles to toilets | 200,000 | 400 (500 units) | |
| Lightweight screed to circulation and core areas to make up levels | 44,800 | 35 (1,280 units) | |
| Durable sealant / hardener to car park, loading bay and plant rooms. | 102,600 | 90 (1,140 units) | |
| Vinyl flooring to security areas | 10,000 | 1 unit | |
| Entrance mats and matwells | 45,000 | 1 unit | |
| Allowance for lining to car park and loading bay | 25,000 | 1 unit | |
| Allowance for other floor finishes | 30,000 | 1 unit | |
| Ceiling finishes | 729,600 | 29.18 | 1.2 |
| GRG feature ceiling to main entrance lobby | 348,000 | 400 (870 units) | |
| Feature drylined ceiling to lift lobbies | 76,000 | 200 (380 units) | |
| Metal tile suspended ceiling to toilets | 50,000 | 100 (500 units) | |
| Painted plasterboard on metal framing to corridors, circulation area, etc | 75,600 | 90 (840 units) | |
| Insulation to car park/loading bay soffits | 30,000 | 30 (1,000 units) | |
| Allowance for access panels, bulkheads and paint to plant room soffits, other sundry ceiling finishes | 150,000 | 1 unit | |
| Fittings/fitting out (excl loose furniture) | 699,500 | 27.98 | 1.2 |
| Allowance for main entrance reception desk and security desks | 100,000 | 1 unit | |
| Stone vanity tops in toilets with holes for basins/taps and mirrors behind | 160,000 | 2,000 (80 units) | |
| Toilet fittings | 49,500 | 550 (90 units) | |
| Extra for fittings to disabled toilets | 15,000 | 1,500 (10 units) | |
| Allowance for rubbish compactor | 25,000 | 1 unit | |
| Allowance for column guards, bollards/crash rails to loading bay/car park, cycle racks, car park traffic management system, statutory signage,other fittings | 350,000 | 1 unit | |
| Sanitary appliances | 187,000 | 7.48 | 0.3 |
| WCs, basins, cleaners sinks, urinals | 175,000 | 500 (300 units) | |
| Extra for disabled toilets. | 12,000 | 1,000 (12 units) | |
| Disposable installations | 370,000 | 14.8 | 0.6 |
| Rainwater disposal system. | 75,000 | 3 (25,000 units) | |
| Soil, waste and vent installation. | 225,000 | 9 (25,000 units) | |
| Extra for drainage to kitchenettes, retail areas etc | 20,000 | 1 unit | |
| Condensate drainage including insulation | 50,000 | 2 (25,000 units) | |
| Water installations | 600,000 | 24 | 1 |
| Cold water services: incoming, storage, pumps, etc | 250,000 | 10 (25,000 units) | |
| Hot water services and distribution | 200,000 | 8 (25,000 units) | |
| Water services for retail, kitchenettes | 50,000 | 2 (25,000 units) | |
| Miscellaneous water supplies | 100,000 | 4 (25,000 units) | |
| Space heating and air treatment | 3,240,000 | 129.6 | 5.5 |
| Gas installation | 40,000 | 1 unit | |
| Boilers, flues and primary pipework distribution | 150,000 | 1 unit | |
| Air handling units and ductwork distribution | 825,000 | 33 (25,000 units) | |
| Water cooled chillers | 425,000 | 17 (25,000 units) | |
| Heat rejection plant | 325,000 | 13 (25,000 units) | |
| LTHW heating including pumps | 425,000 | 17 (25,000 units) | |
| CHW installation including pumps and riser pipework | 550,000 | 22 (25,000 units) | |
| Condenser water installation | 300,000 | 12 (25,000 units) | |
| Metering LTHW/CHW installations | 100,000 | 4 (25,000 units) | |
| Reception air conditioning | 100,000 | 4 (25,000 units) | |
| Ventilation installations | 600,000 | 24 | 1 |
| Toilet extract installation | 175,000 | 7 (25,000 units) | |
| Ventilation to plant room, lift motor rooms, refuse area, etc | 75,000 | 3 (25,000 units) | |
| Car park and basement ventilation | 150,000 | 6 (25,000 units) | |
| Stair and lobby pressurisation | 200,000 | 8 (25,000 units) | |
| Electrical installation | 2,450,000 | 98 | 4.2 |
| HV switchgear and transformer | 150,000 | 6 (25,000 units) | |
| LV distribution and rising busbars. | 1,050,000 | 42 (25,000 units) | |
| Power to mechanical plant. | 75,000 | 3 (25,000 units) | |
| Small power installation. | 150,000 | 6 (25,000 units) | |
| Lighting, emergency lighting. | 500,000 | 20 (25,000 units) | |
| Lighting, emergency lighting to car park and basement | 75,000 | 3 (25,000 units) | |
| Enhanced lighting in lobby and other areas. | 50,000 | 1 unit | |
| External building lighting. | 150,000 | 1 unit | |
| Life safety only standby generator installation, including flues, acoustics, fuel installation | 175,000 | 1 unit | |
| Miscellaneous wireways | 25,000 | 1 (25,000 units) | |
| Earthing and bonding | 50,000 | 2 (25,000 units) | |
| Lifts and escalators | 2,130,000 | 85.2 | 3.6 |
| Passenger lifts, 21-person; 2.5m/s; | |||
| serving 10 floors, DHC | 1,170,000 | 195,000 (6 units) | |
| Goods lift serving | 200,000 | 1 unit | |
| Vehicle park lift | 160,000 | 1 unit | |
| Firefighting lift | 320,000 | 160,000 (2 units) | |
| Enhanced lift car finishes | 120,000 | 20,000 (6 units) | |
| Builders work, control system, miscellaneous extras | 160,000 | 1 unit | |
| Protective installations | 600,000 | 24 | 1 |
| Protective installations sprinkler | |||
| installations: tanks, pumps, risers etc. | 500,000 | 20 (25,000 units) | |
| Dry riser installation | 50,000 | 2 (25,000 units) | |
| Lighting protection | 50,000 | 2 (25,000 units) | |
| Communication installations | 515,000 | 20.6 | 0.9 |
| Fire alarm installations. | 375,000 | 15 (25,000 units) | |
| Landlord security provisions | 100,000 | 4 (25,000 units) | |
| Disabled alarms, refuge alarms, induction loops | 40,000 | 1 unit | |
| Special installations | 650,000 | 26 | 1.1 |
| Building management system | 625,000 | 25 (25,000 units) | |
| Leak detection system | 25,000 | 1 unit | |
| Builders work | 562,425 | 22.5 | 1 |
| Builders work in connection with services installations, including machine bases, steel framework, fire stopping, etc: overall allowance | 562,425 | 22 (25,000 units) | |
| Preliminaries and contingencies | 14,816,701 | 592.67 | 25.4 |
| Main contractors preliminaries and OH&P @ 23% | 10,415,928 | ||
| Risk transfer at 3% and construction contingency at 5% | 4,400,773 | ||
| Total shell and core works | 58,397,988 | 2,335.92 | 100 |
| CATEGORY A FIT-OUT WORKS | |||
| Wall finishes | 134,000 | 5.36 | 1.5 |
| Emulsion paint finish to office side of core walls | 10,750 | 5 (2,150 units) | |
| Column casings, including paint, sub frame etc | 123,250 | 85 (1,450 units) | |
| Floor finishes | 828,000 | 33.12 | 9.3 |
| Dust sealer to concrete slabs | 18,000 | 1 (18,000 units) | |
| Medium grade fully accessible raised floor, metal faced plycore; 600x600 tile size, 150 nominal depth; including fire barriers. | 810,000 | 45 (18,000 units) | |
| Ceiling finishes | 990,000 | 39.6 | 11.1 |
| Concealed grid metal tray suspended ceiling to office areas; acoustic quilt and fire breaks | 990,000 | 55 (18,000 units) | |
| Fittings / fitting out | 27,000 | 1.08 | 0.3 |
| Allowance for statutory signage | 27,000 | 1.5 (18,000 units) | |
| Space heating, air treatment | 3,024,000 | 120.96 | 33.8 |
| Four-pipe fan-coil units. | 486,000 | 27 (18,000 units) | |
| Distribution ductwork, plenums, grilles, diffusers,insulation, etc | 1,080,000 | 60 (18,000 units) | |
| CHW installation, insulation | 702,000 | 39 (18,000 units) | |
| LTHW installation, insulation | 540,000 | 30 (18,000 units) | |
| Condensate installation, insulation | 216,000 | 12 (18,000 units) | |
| Electrical installations | 1,584,000 | 63.36 | 17.7 |
| Distribution boards | 90,000 | 5 (18,000 units) | |
| Lighting and emergency lighting installation - LED | 1,080,000 | 60 (18,000 units) | |
| Lighting control | 216,000 | 12 (18,000 units) | |
| Small power: supply only floor boxes | 72,000 | 4 (18,000 units) | |
| Mechnanical power | 72,000 | 4 (18,000 units) | |
| Earthing and bonding | 54,000 | 3 (18,000 units) | |
| Protective installations | 360,000 | 14.4 | 4 |
| Sprinkler protection to offices | 360,000 | 20 (18,000 units) | |
| Special installations | 396,000 | 15.84 | 4.4 |
| Building management system | 396,000 | 22 (18,000 units) | |
| Builders work in connection | 134,100 | 5.36 | 1.5 |
| Builders working in connection with category A services | 134,100 | 7.45 (18,000 units) | |
| Preliminaries and contingencies | 1,472,989 | 58.92 | 16.5 |
| Main contractor preliminaries & OH&P at 14% | 1,046,794 | ||
| Contigency and design reserve at 5% | 426,195 | ||
| TOTAL CATEGORY A WORKS | 8,950,089 | 358 | 100 |


No comments yet