


Despite wobbles in the global economy and a dip in private commercial construction, overall activity in the industry remains strong. Michael Dall discusses the ups and downs of Barbour ABI’s monthly Economics & Construction Market Review
Economic context
The second estimate of GDP confirmed that the UK economy grew by 0.7% in Q2 2015. After a slowdown in the growth rate to 0.4% in the first quarter, this marked a return to the average growth rate since the end of 2012.
Analysing the nature of GDP growth shows that consumer expenditure is the single biggest source, increasing by 2.1% on the same period a year ago. Fixed investment also increased, by 0.8%, with net trade and government consumption adding 0.5% and 0.4% respectively.
The labour market continues to perform particularly strongly in the UK with the unemployment rate remaining stable over recent months. The rate of unemployment is currently 5.5% for those aged 16 and over, down from 5.6%in June 2015.
The rate of inflation remained at 0% in August, with the continued decline in oil and a lower rise in clothes prices the main reasons for this. Most commentators expect inflation to start growing towards the end of the year as these falls will be factored into the yearly change figures. However, the price of oil remains low and the impact of this may to be suppress the inflation rate for longer than originally anticipated.
Other news this month on the UK economy includes:
- UK shares suffered on “Black Monday”, which was driven by fears of a slowdown in economic growth in China
- A survey from the British Retail Consortium showed that like-for-like retail sales in the UK fell by 1.0% in August 2015
- Manufacturing trade body, the EEF, halved its forecast for sector growth in 2015 to 0.7%, down from 1.7% at the start of the year.
The construction sector
The latest figures from the Office for National Statistics (ONS) show that the construction sector in the UK shrank by 1% between June and July 2015. Comparing output levels with July last year showed a decrease of 0.7%.
The main reason for the monthly falls in output are declines in private housing output and private commercial. New private housing decreased by 2% between June and July 2015 but was 0.8% higher than the corresponding month in 2014. Output in the private commercial sector fell by 2.9% between June and July, and by 3.2% in July 2014. The decline in commercial is concerning for industry growth prospects but it should be noted that private housing output is still higher than this time in 2014. The performance of the infrastructure sector is encouraging, however, with output 17.4% higher in July 2015 compared with July 2014.
The ONS/Barbour ABI new orders for Q2 2015 showed that total order levels decreased by 0.4% between Q1 and Q2 2015 but were 1.9% higher than a year ago. Yearly growth was recorded in the infrastructure, private housing and private industrial sectors, indicating a broadening growth within the industry.
The CPA/Barbour ABI Index, which measures the level of contracts awarded using January 2010 as its base month, recorded a reading of 151 for August. This is an increase from the previous month and continues to support the view that overall activity in the industry remains strong. The readings for private housing remain high at 235. Commercial offices activity also increased in August, recording a figure of 123, up from 100 in July.
According to Barbour ABI data on all contract activity, August witnessed a small decrease in construction activity levels with the value of new contracts awarded £6.4bn, based on a three-month rolling average. This represents a minor 0.3% decrease from July, although this is still a 22.4% increase on the value recorded in August 2014. The number of construction projects within the UK in August decreased by 6.6% on July, but was still 6.3% higher than August 2014.
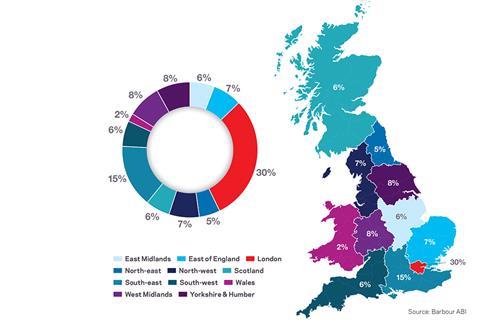
The majority of the contracts awarded in August by value were in London, accounting for 30% of the UK total. This is followed by the South-east with 15% of contract value awarded, with the remaining regions seeing a fairly even split. The strong performance of London is primarily due to the award of the £416m contract for Lot 1 of the Thames Tideway Tunnel. A major office development at 1 Park Place at Canary Wharf also contributed £200m to the region’s total. The regeneration of London Road Industrial Estate in Newbury contributed £125m toward the South-east total.
Types of project
The residential sector had the highest proportion of contracts awarded in August with 31% of the total value of projects awarded. An £80m housing development at Wembley Park in London led the way. Infrastructure followed hot on the heels, contributing 26% of the total value of projects awarded. As mentioned earlier, the Thames Tideway Tunnel dominated but renewables performed well, led by a £66m wind farm in the Highlands of Scotland.
Locations of contracts awarded in August
Contracts awarded
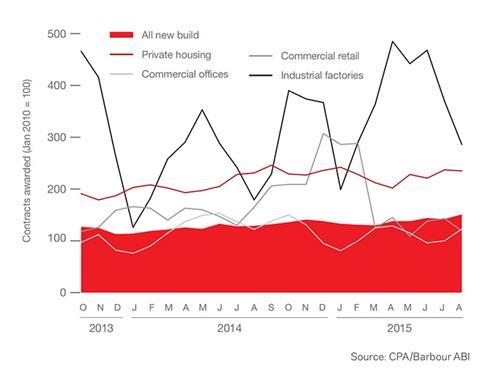
Construction activity by sector
| % change | ||
|---|---|---|
| July 2014 - July 2015 | June 2015 - July 2015 | |
| Total all work | -0.7 | -1.0 |
| All new work | 1.0 | -1.5 |
| Public housing | -15.6 | -5.8 |
| Private housing | 0.8 | -2.0 |
| Infrastructure | 17.3 | 2.7 |
| Public (ex infrastructure) | -3.4 | -4.5 |
| Private industrial | 4.9 | 6.6 |
| Private commercial | -3.2 | -2.9 |
| Repair & maintenance | -3.4 | 0.0 |
| Public housing | -2.2 | -2.6 |
| Private housing | -0.4 | -0.8 |
| Non-housing | -5.8 | 1.4 |
Source: ONS
Construction performance by sector
Spotlight on infrastructure
The value of contracts awarded in the infrastructure sector decreased in August with the total value awarded down to £1.6bn based on a three-month rolling average. This is a 19.5% decrease from the previous month but still represents a total 48.1% higher than the same month last year. In the three months to August the total value of contract awards was £5.3bn based on a three-month rolling average. This is 7.2% higher than the previous three months and 59.3% higher than the same period in 2014. This represents a significant increase on last year’s totals and if these awards can be translated to “shovels in the ground” could have a significant impact on the construction sector as a whole.
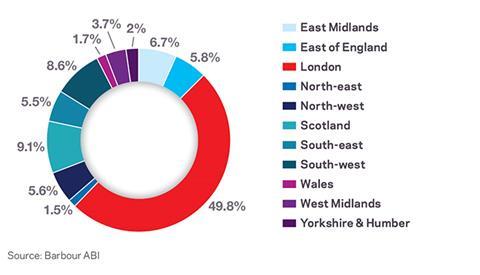
London was the major contributor to the total values of contracts awarded, accounting for a significant 49.8%. This was almost solely down to the award of the Thames Tideway Tunnel at a cost of £416m. A Northern Roundabout improvement package at the Elephant & Castle also provided £25m. The rest of the contracts were shared across the regions with no other region accounting for more than 10% of the total.
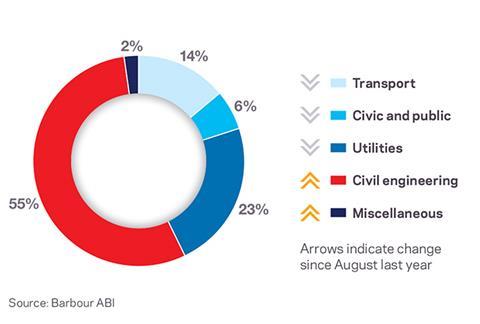
Civil engineering dominated the sector splits in August thanks to the Thames Tideway Tunnel. Its £416m total meant the civil engineering sector represented a massive 55% of total values of contracts awarded, up 46% on the same month last year. Utilities performed next best, accounting for 23% of the total values of contract awarded, although this was 30% down on last year’s contribution.
The Summer Budget 2015 announced that the government will introduce a roads fund from the proceeds of Vehicle Excise Duty from the year 2020. This is to ensure sustained investment is made in road maintenance. It also committed to publishing a second Roads Investment Strategy for the years 2020-25.
Other announcements included plans to extend devolution to the northern regions of England to build on the “northern powerhouse” concept and announced plans to establish Transport for the North as a statutory body.
Finally, the government plans to extend the Coastal Communities Fund by at least £90m until 2020/21.
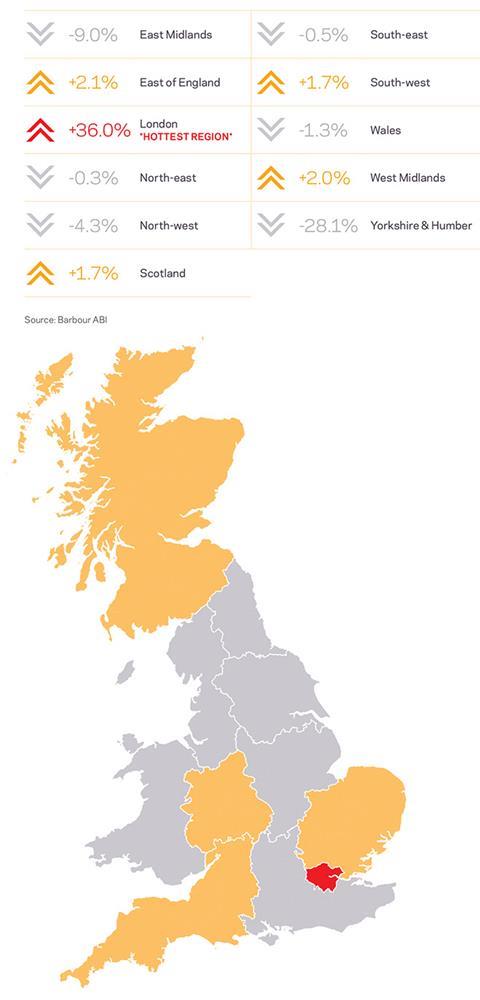
Map and figures: How infrastructure activity has changed since August 2014
Type of projects awarded
Value of contracts by region
Top 10 key clients: Sep 2014-Aug 2015
| Company name | Awards | Value (£M) | |
|---|---|---|---|
| 1 | Highways England | 86 | 1,763 |
| 2 | E.ON | 3 | 1,326 |
| 3 | Transport Scotland | 10 | 1,145 |
| 4 | Aberdeen City council | 6 | 1,072 |
| 5 | Welsh Assembly Government | 4 | 820 |
| 6 | Battersea Power Station Development Company | 1 | 600 |
| 7 | Green Energy Parks | 1 | 600 |
| 8 | DONG Energy AVS | 3 | 592 |
| 9 | Scottish Govenment | 1 | 530 |
| 10 | Thames Water Utilities | 3 | 423 |
Top 10 key contractors: Sep 2014-Aug 2015
| Company name | Awards | Value (£M) | |
|---|---|---|---|
| 1 | Aberdeen Roads | 5 | 1,060 |
| 2 | Vinci Construction UK | 21 | 974 |
| 3 | Costain/Skanska JV | 3 | 890 |
| 4 | Balfour Beatty Group | 40 | 824 |
| 5 | KNM Group | 1 | 600 |
| 6 | Ferrovial Agroman Laing O’Rourke JV | 1 | 600 |
| 7 | Bam Nuttall | 20 | 498 |
| 8 | Morgan Sindall | 9 | 487 |
| 9 | Laing O’Rourke | 4 | 309 |
| 10 | Interserve | 14 | 290 |

Learn more about this topic at the ‘Infrastructure, cities and the northern powerhouse’ session at this year’s Building Live event on 26 November.
For more information and to book tickets go to:
www.building-live.co.uk/programme
Downloads
ECMR September 2015
PDF, Size 0 kb


No comments yet