


Lifecycle analysis suggests that, when it comes to transport hubs, the most energy-efficient option is not always the most obvious
01 / Introduction
A quarter of the UK’s carbon emissions arise from transport. Although evaluating infrastructure is complex, there is huge potential for this sector to help the UK to meet its target of reducing carbon emissions by 80% by 2050.
In this article we give a glimpse into the world of carbon-footprinting large UK infrastructure projects and illustrate how appraisals differ to conventional building-based carbon footprinting studies by focusing on the passenger and travel distance.
To illustrate these issues, we have included an excerpt from our recent report to the independent Davies Commission on the future of London’s airports. This shows that if carbon (which for the purposes of this article is used to describe the whole bundle of greenhouse gases and carbon dioxide equivalents, including methane, nitrous oxide and CFCs) was made a deciding factor in the location of London’s new airport, it could save the equivalent of 3.5% of the UK’s annual greenhouse gas emissions over a seven-year period.
So how does the carbon-footprinting of infrastructure projects compare to that of individual buildings? The main difference arises not from the aggregation methods and data but in the techniques we need to employ to understand the findings.
Transport is all about moving people, so it is not just a question of amounts per unit of area, but more about how efficiently we move someone from A to B - that is, the carbon impact per person per km. For some transport types, it may also be found that the construction of an interchange generates large amounts of carbon emissions, which should also be included in any appraisal.
By way of illustration, travelling by boat generates very little carbon emissions in movement but harbours require enormous amounts of embodied carbon to build. This contrasts with, say, travelling by car, which generates up to nine times more carbon emissions per passenger km, but has a much smaller initial embodied carbon investment, generally limited to the vehicle itself.
This is not to give the impression that travel by car is always good for short distances and travel by boat is good for long - it is more complicated than that. However, the main issues can be summarised under the following four headings:
- Fixed and variable embodied carbon emissions Building a terminal emits a “fixed” amount of carbon, but the emissions associated with the construction of routes (roads, railways, and so on) vary depending on distance. Understanding this point is important when dealing with modes of transport that require large embodied carbon expenditures in creating terminal facilities.
- Relation between embodied and operational carbon per mode of transport Understanding this is important in ensuring that we are not just swayed by modes of transport, such as shipping, that have low operational movement costs but enormously large hidden embodied costs at the port facilities themselves.
- Accessibility and catchment areas Large pieces of infrastructure such as airports and terminal stations are destinations in themselves. It is therefore important to understand the carbon impacts generated by passengers getting to and from the station or airport and not just the impacts of the onward journeys.
- System thinking In reality, people’s choices are dynamic. If a faster train line is built into a city, car drivers may become train passengers, but they may revert to driving if fares are increased too much. Understanding this point is important in evaluating proposals where more than one type of infrastructure is being provided, as composite effects may accrue.
02 / Whole-life carbon in the context of infrastructure projects
Whole-life carbon analysis is a methodology to quantify all carbon emissions released by any project within the built environment from the moment that materials are extracted or manufactured until the constructed elements need to be demolished and disposed of. The European standard CEN/TC 350 identifies four stages in the life of a building, which can also be applied to infrastructure schemes:
Product manufacture This encompasses the extraction of raw materials, their transport to a point of manufacture and the process of transforming them into construction products. In the production of reinforced concrete, this stage would include the emissions associated with extraction and production of cement, sand, gravel and steel and their manufacture into a piece of infrastructure.
- Construction This stage involves transportation of construction products to site and the on-site processes involved in assembling them into buildings. In the case of infrastructure, this may include the emissions from tunnel-boring machines, site facilities or the complex temporary works required to make these projects possible.
- In use This includes the required maintenance and fuel consumption of vehicles and craft, as well as any emissions generated from the terminal facilities, such as energy and water involved in providing heating and lighting.
- End of life All buildings and infrastructure are eventually replaced due to obsolescence or having reached the end of their safe working lives. At this stage, the emissions are calculated from the dismantling and disposal of the elements of the infrastructure.
For each of the above lifecycle stages, more detailed sub-category breakdowns exist. Please refer to EN 15804, which was published in early 2012 and establishes product category rules for environmental product declarations, and BS EN 15978 - published in 2011 - which incorporated CEN/TC 350 into UK standards.
For a more general overview please refer to Sturgis’ guidance document published for the British Council for Offices: www.bco.org.uk/Research/Publications/WholeLife2565.aspx
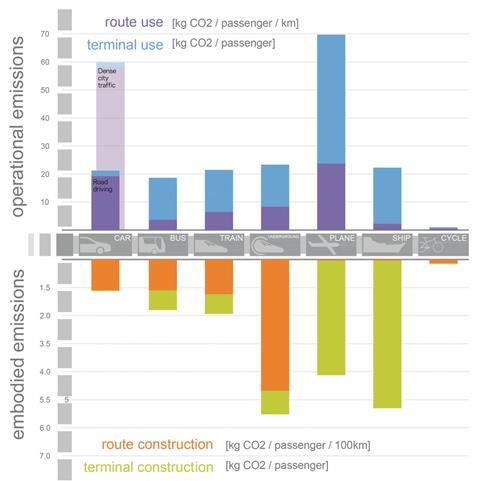
A: Embodied and operational carbon of different modes of transport
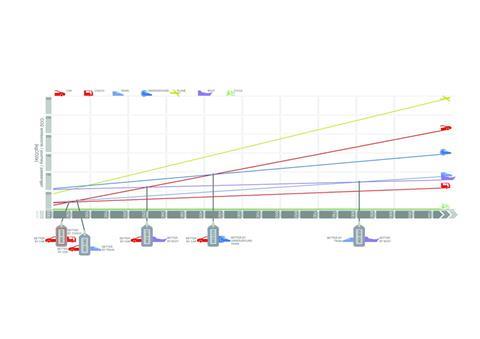
B: Relationship between construction of terminal facilities and emissions generated on route
03 / Whole-life carbon emissions of different forms of transport
Graph A illustrates how different modes of transport compare in terms of embodied and operational carbon emissions. It also identifies for each mode if the emissions are generated from the terminal or route use/construction. Figures are presented on a per person and km basis given a 60-year lifecycle and the predicted passenger capacity over this timeframe. The interrelation of these parameters shows the character and possibilities of each mode of transport.
The graph confirms some basic intuitive trends: investing in large terminal facilities is only worthwhile from a carbon perspective when the onward transport route costs are low and long distances are to be travelled. Similarly, investing in public infrastructure with high embodied route costs is only worthwhile if the cars displaced would have been on congested roads.
Graph B shows a simplified view of the transport world where all fixed terminal and variable route costs are taken into consideration. Please note that this graph is not intended to provide a basis for individuals to choose means of transport but more for transport planners considering aggregate choices for a population as
a whole.
For instance, if the average journey distance on a railway between two stations was shorter than 65 miles and uncongested travel by car on a motorway was an alternative, investing in the road infrastructure would be the better solution from a carbon perspective as the whole-life carbon costs of the rail link would be greater. If, on the other hand, the rail terminal on this route can be shared with other longer distance routes, travel by rail becomes vastly more attractive.
In term of the initial construction, building a central London underground station generates the most embodied carbon on a per passenger basis over a 60-year lifespan.
04 / London’s new airports
To illustrate the infrastructure themes discussed previously, sections 4-7 are an excerpt from an independent report that Sturgis submitted to the Davies Commission into the provision of additional airport capacity in London. For simplicity, it includes just two of the proposals analysed. The first is for a new four-runway hub airport in the Thames Estuary, and the second relies on building on existing infrastructure by making Gatwick and Stansted the same size as Heathrow and linking them to central London through faster rail links. The latter is referred to as the constellation airport. Both proposals meet the same passenger demand.
The scope of this evaluation was to assess not only the operational carbon emitted during the airport’s everyday activities, but also the embodied carbon required to build, maintain and upgrade the facilities over a 60-year lifespan. Whole-life analysis of the different schemes is important as the building of the Estuary airport would require the decommissioning of Heathrow.
The emissions were classified under the following categories:
- Construction, upgrade and use of the airport facilities, such as terminals, runways, hangars, and so on. Depending on the location, the airport construction may include large amounts of reclaimed land. In addition, if any airport is demolished, the carbon emitted in the process will be included here.
- Construction of facilities directly associated with airport activities, but often located outside their limits, such as warehouses, hotels and car parks. The quantity of these facilities is dependent on the type of services an airport offers, as well as the routes and passengers they serve.
- The construction and upgrade of transport infrastructure, such as railway lines, train stations or highways, to access the airports.
- The emissions caused by passengers in accessing the airport. These emissions vary depending on factors like travel distance, accessibility to different modes of transport and passengers’ preferences.
05 / The two proposals
Following the Department for Transport’s latest forecasts, both proposals meet the capacity of 210 million passengers per year. The key characteristics of each scheme are as follows.
Estuary airport
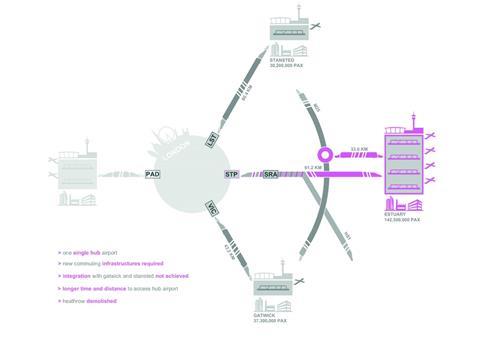
This proposal is for a four-runway airport located in the Thames Estuary with capacity for 142 million passengers. The additional 68 million would be provided for by Gatwick and Stansted, which would operate with one runway each. Heathrow would be closed and demolished.
The benefits of this proposal include:
- Single major international hub: it might be the only practical way of avoiding “patching” solutions
- Acoustic pollution: a well-located and planned hub will diminish the nuisance to residents
- Transfers: it will provide greater connecting possibilities to passengers.
The disadvantages include:
- Location: over 60km from London, further than any other airport currently operating
- Market: with 78% of passengers having London as a destination, a hub may not be required
- Closure of Heathrow: this would imply a massive relocation of companies, infrastructure and people
- Accessibility: a single airport will be well located for central London and some regions, but it will be difficult to access for most of the UK population
- Need for new infrastructure: major investment will be required to connect an unpopulated area
- Flexibility issues: With a hub airport, phasing of additional capacity is difficult to implement.
Constellation airport
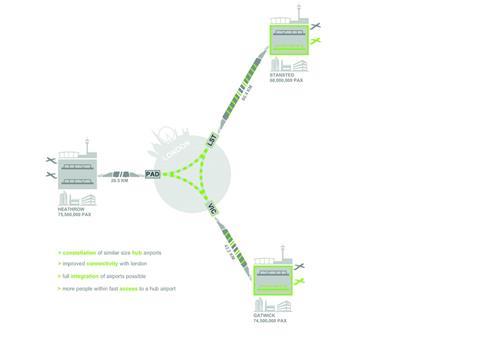
The second proposal adds one runway at Stansted and another at Gatwick, creating a constellation of three main airports of similar size around London. Heathrow would operate at a slightly higher capacity after upgrade plans.
The benefits include:
- Existing facilities: upgrading existing infrastructure will require less investment - and lower carbon emissions
- Location: all airports are closer to London’s city centre and the majority of the UK population
- Accessibility (UK): shorter travel distance and direct connection to at least one major airport will provide most UK regions with a wider range of modes of transport to choose from
- Accessibility (London): existing rail lines already connect the airports to central London, which will be simpler to upgrade than creating new links
- Flexible delivery: expansion of the airports can be phased.
The disadvantages include:
- Older infrastructure: updated existing infrastructure may not work as efficiently as new
- Acoustic pollution: the amount of people subjected to noise and pollution will not decrease
- No major hub: does not give the UK the potential to become a European hub.
06 / Findings
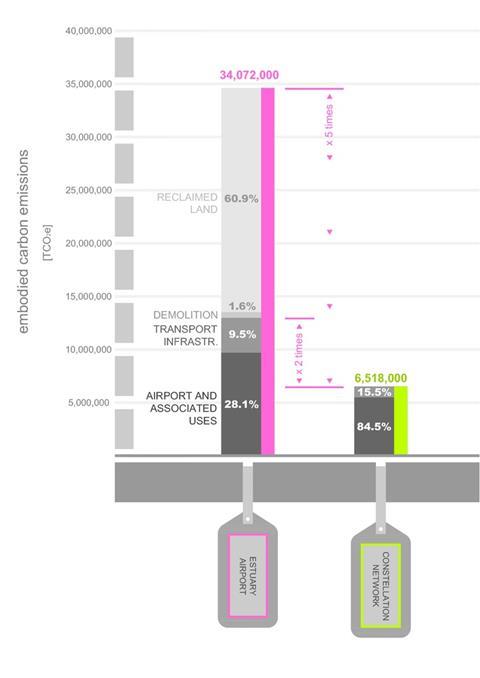
Building the airport: embodied carbon emissions
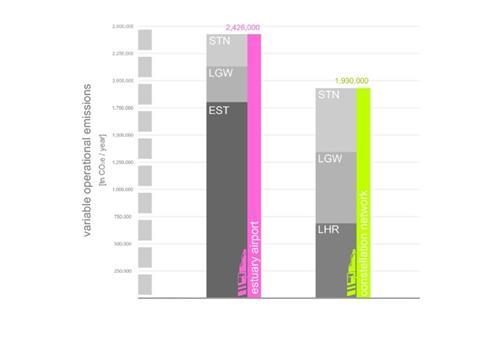
Travelling to the airport: route operational carbon emissions
- The construction of the new Estuary airport would emit 34 million tonnes of carbon dioxide equivalent (CO2e). That is more than five times more CO2e than building the Constellation Airport
- 34 million tonnes of CO2e is more than the annual carbon emissions of
- New Zealand
- The construction of the new airport facilities and their associated uses in the Estuary airport would emit 70% more than completing the existing facilities in the constellation airports - 4.2 million tonnes of CO2e more
- 4.2 million tonnes of CO2e is the equivalent of building more than 50,000 new homes
Variable operational carbon emissions are the emissions that depend on the airport location. They include commuting to and from the airport and they have been estimated considering Civil Aviation Authority passenger survey statistics.
- The Estuary airport would emit 500,000 tonnes of CO2e more per year than the constellation airport. That is 25% more annual emissions
- In 30 years, the Estuary airport would have emitted 33% more CO2e than the constellation airport
- In 60 years, the difference between the CO2e emissions accrued by going to and from the Estuary airport and the constellation airport would double
Whole-life carbon impact
Over 35 years, the time predicted by the CAA before further airport capacity is needed, the estuary airport will have emitted a total of 63% (43m tonnes CO2)more than the constellation option for the same capacity and demand.
07 / Lessons learned
1. Embodied carbon emissions: different impacts of terminals and routes
The carbon “fixed costs” to build terminals differ greatly from the carbon “variable costs” for routes. Distance becomes a critical factor to be considered. Decisions on where to build an airport should be based on catchment areas of air passengers accessing the airport, because emissions generated by passengers getting to an airport are by far the most significant factor influencing airport carbon emissions over an airport’s lifetime.
2. Relative impacts of embodied and operational emissions
Modes of transport with high embodied costs for terminal construction are more suitable for long distance routes with low operational costs. This is well illustrated by travel by boat, where the embodied carbon of building a harbour is among the highest while the operational emissions of travel by boat are some of the lowest. The crucial point here is not to just be swayed by operational impacts alone.
3. Commuting to terminals
Major terminal buildings are destinations in themselves. Shorter distances to terminals and locating them in catchment areas with high numbers of users is critical to reducing both the embodied and the operational carbon. Distribution of population and access to different modes of transport are also essential parts of the equation. Sometimes locating a major terminal further away from a major city would emit less carbon if the catchment area for inter-regional commuting is larger.
4. System thinking
Where more than one mode of transport is available, people’s dynamic choices should be considered. Factors like ticket fares or ease of transfer between modes of transport when carrying luggage might drive people choices towards longer or more carbon-intensive possibilities.


No comments yet