


All articles by Experian Economics – Page 4
-
 Features
Tracker: December 2015
The construction and activity index expanded by 10 points, recovering from the November’s low and hitting positive territory for the first time in five months
-
 Features
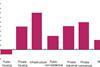
Building intelligence: Q3 2015
The latest figures from the Office for National Statistics show that total construction output dropped across the quarter, but is marginally up on a year ago
-
 Features
Tracker: November 2015
The construction activity index drops into negative territory for its third time in 12 months, while most individual regions experience a soft decrease in activity level
-
 Features
Tracker: October 2015
The construction activity index is showing notable weakness, while the majority of the country’s regions suffer a second consecutive contraction in activity levels
-
 Features
Tracker: September 2015
The construction activity index strengthened slightly after falling into negative territory last month, but the order index worsened for the second successive month in a row
-
Features
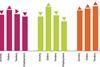
Building intelligence: Q2 2015
The latest figures from the Office for National Statistics show that total construction output remained flat over the quarter, but registered above levels recorded for the same period last year. Experian Economics reports
-
 Features
Tracker: August 2015
After last month’s positive movement, the construction activity indicator falls into negative territory for the month, while employment prospects take a nervy dip
-
 Features
Tracker: July 2015
The construction activity index took a leap upwards after contraction the month before, while the UK composite index saw its largest increase since 2012
-
 Features
Tracker: June 2015
Orders continue to rise sharply across each sector, making the overall construction activity index’s drop into negative territory for the first time in almost three years a nasty surprise. Experian Economics reports
-
 Features
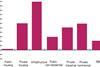
Building intelligence: Q1 2015
The latest figures from the Office for National Statistics show that total construction output hit its highest year-on-year level since 2008. Experian Economics reports
-
 Features
Tracker: May 2015
The construction activity index picked up again following a fallow April, while the number of respondents posting no construction activity constraints reached an all-time high
-
 Features
Tracker: April 2015
Constraints on activity tightened in April and the orders index has stopped growing but there’s less worry about labour shortages even though employers look set to take on more workers
-
 Features
Tracker: March 2015
While concern about constraints has edged up, the orders index has hit a record high and things are looking up for nearly every region
-
 Features
Tracker: February 2015
Orders and tender enquiries are looking healthy, and reporting of constraints is down. But employment prospects are a worry for some
-
 Features
Building intelligence: Q4 2014
Experian Economics shows that 2014’s construction output increased 7% on the previous year’s total, with the housing sector performing particularly well
-
 Features
Tracker: January 2015
The construction activity index holds steady for the month at 62 points, meanwhile the majority of the regional indices feel an increase in activity
-
 Features
Tracker: December 2014
The construction activity index sees a one-point increase for the month to take it to 61 points, while the majority of regional indices saw a decrease in activity
-
 Features
Building intelligence: Q3 2014
Experian Economics shows that construction activity increased 2% on the previous quarter, taking it 6% above the level taken for the same period in 2013
-
 Features
Tracker: November 2014
The construction activity index holds its position at 60 points, while the regional composite indices show that the majority of regions saw a decrease in activity
-
 Features
Tracker: October 2014
With the non-residential and civil engineering sectors bouncing back, the construction activity index made a seven-point month-on-month jump to 60 points